Please use a handheld calculator, specifically the one you will be using for the test. Do not use your cell phone calculator.
#1-6
Learning Target: I can use information presented in a two-way table to compute a percent and a probability.
1 point
1
Question 1
1.
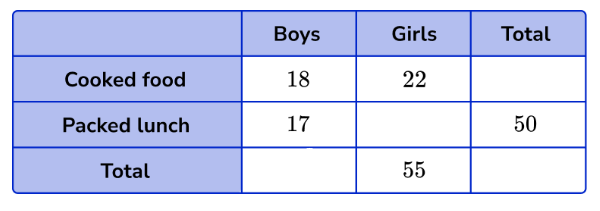
At Green High School a sample survey was conducted to see how many students preferred eating the cooked food at the cafeteria verse bringing their own packed lunch. The results were broken down by gender in the following two-way table.
Compete the two-way table and answer #2-6 based on the data in the two-way table.
Other Answer Choices:
33
40
35
90
1 point
1
Question 2
2.
What percentage of boys packed their lunch?
Hint:Percent = Part/Whole x100
1 point
1
Question 3
3.
What percentage of students preferred having a packed lunch? Round to the nearest tenth of a percent.
Hint: Percent = Part/Whole x100
1 point
1
Question 4
4.
A student is chosen at random during lunch. What is the probability that a student chosen is female? Round to the nearest hundredth.
1 point
1
Question 5
5.
A student is chosen at random during lunch. What is the probability given this is a female student with a packed lunch? Round to the nearest hundredth.
Hint: *P(A|B) = P(A and B)/P(B), where A = packed lunch student and B =female
1 point
1
Question 6
6.
A student is chosen at random during lunch. What is the probability given this student has packed lunch is female? Round to the nearest hundredth.
Hint: *P(A|B) = P(A and B)/P(B), where A = female student and B = packed lunch
#7-11
Learning Target: I can calculate the population density over a region.
The area of the state of Wisconsin is 65,496 mi2. Answer the following question about the state of Wisconsin.
1 point
1
Question 7
7.
The state of Wisconsin estimates that there were approximately 1,669,100 deer post-hunting season in 2022. What is the population density of deer in our state per square mile? Label and round your answer to the nearest whole number.
1 point
1
Question 8
8.
The state of Wisconsin has approximately 8 million squirrels. What is the population density of squirrels in our state per square mile? Label and round your answer to the nearest whole number.
1 point
1
Question 9
9.
How many more times dense is the squirrel population than the deer population?
Learning Target: I can calculate a unit rate.
1 point
1
Question 10
10.
What is the price per a square foot for this new home in Kenosha?
Label and round your answer to the nearest penny.
1 point
1
Question 11
11.
Google Map of Tremper to Bradford
Calculate the average miles per hour to travel 4.4 miles from Tremper to Bradford High School in 12 minutes.
Hint: Convert minutes to hours first.
#12-14
Learning Target: I can calculate and use percentages to determine the outcome of an election.
In a high school election there were 4 candidates that ran for senior class president: Heather, Sergio, Mike, and Natasha. The results of the election are shown in the preference table below.
Use the election results in the table to answer #12-15 below.
1 point
1
Question 12
12.
How many votes are need to win a simple majority in this election?
1 point
1
Question 13
13.
Since there is no candidate with a simple majority, employ the Instant Runoff Method to determine a winner for school president. Who wins the instant runoff?
2 points
2
Question 14
14.
If the school were to use the Borda Count Method to determine the winner of the election. How many points would each candidate receive? Use the following weight system: 4 points for 1st choice, 3 points for 2nd choice, 2 points for 3rd choice, and 1 point for 4th choice.
Draggable item
arrow_right_alt
Corresponding Item
257 points
arrow_right_alt
Heather
327 points
arrow_right_alt
Sergio
218 points
arrow_right_alt
Mike
198 points
arrow_right_alt
Natasha
#15-20
Learning Target: I can use Geometry and numeracy to determine a fair map based on percentages.
Consider the following district map with 5 districts. The red squares represent Party A voters, and the blue squares represent Party B voters. Each district has 5 voters.
Answer the following questions based on the district map above.
2 points
2
Question 15
15.
Fill in the blank:
Party A has _______ percent of the voters in the district map.
Party B has_______ percent of the voters in the district map.
2 points
2
Question 16
16.
Fill in the blank:
Party A has _______ percent of the districts in the map.
Party B has_______ percent of the districts in the map.
1 point
1
Question 17
17.
Based your percentages, decide if the district map is fair. Explain your answer using complete sentences.
1 point
1
Question 18
18.
Calculate the EG. Based on your EG, decide if the map is fair in terms of waisted votes. Explain your answer using complete sentences.
Hint: Compare your EG to 7%. Less than 7% is a fair map.
1 point
1
Question 19
19.
Calculate the PPS for District 1. Based on your PPS, decide if the map is fair based on compactness. Explain your answer using complete sentences.
Hint: Closer to 0 is more gerrymandering and closer to 1 is less gerrymandering.