Context 23b - Distinguishing Distribution
star
star
star
star
star
Last updated over 1 year ago
9 questions
Note from the author:
MMR Resources

1
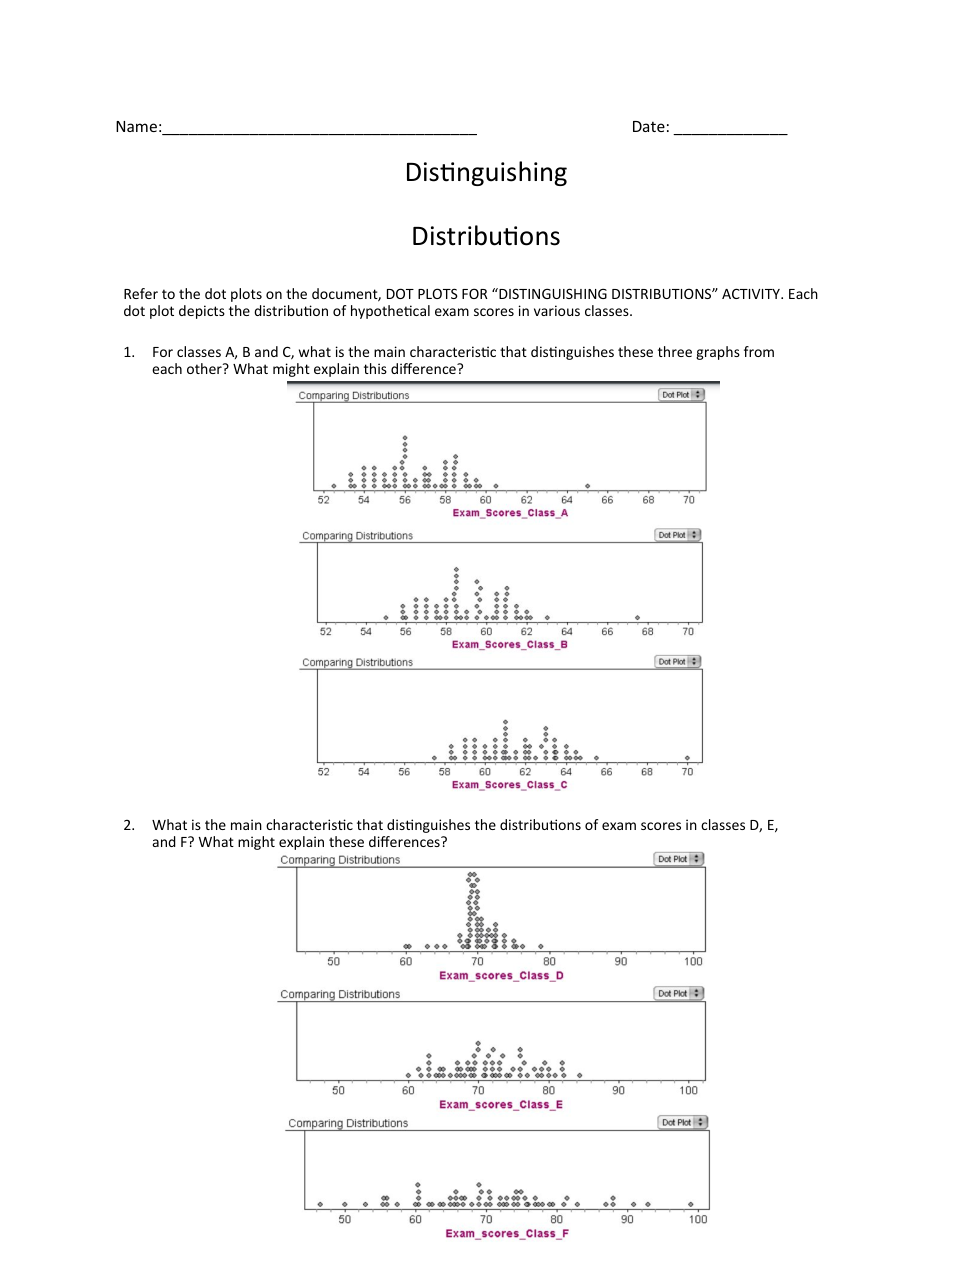
For classes A, B, and C, what is the main difference between these graphs and what might explain this difference?
1
For classes D, E, and F, what is the main difference between these graphs and what might explain this difference?

1
For classes G, H, and I, what is the main difference between these graphs and what might explain this difference?
1
4. What strikes you as the most distinctive features of the distribution of exam scores in class J? What might be an explanation for this characteristic?
1
5. What strikes you as the most distinctive feature of the distribution of exam scores in class K? What might be an explanation for this characteristic?

1
Look again at the graph for class D. If you wanted to tell someone about how the students did on this exam, what would you say?
1
What if we tried to look at the “bulk” of the data? Now, what would you say?
1
Look again at the graph for class E. If you wanted to tell someone about how the students did on this exam, what would you say?
1
What if you were told that most exam scores for a class were between 65 and 85, and that the overall range of scores for that class was between 30 and 100? Try to imagine what that distribution would look like. Sketch it below.