Warm-Up 27 - Heating Curves
Heating curves show a change in temperature and changes of state while adding heat (q).
Heating curves show a change in temperature and changes of state while adding heat (q).
Use the following charts to answer the questions.
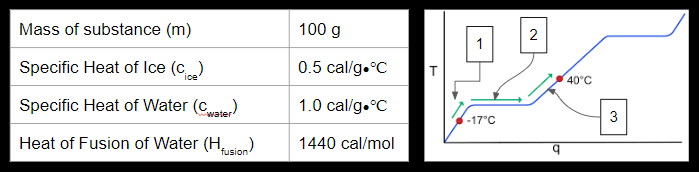
Suppose we wanted to calculate the number of calories to heat solid water (ice) from -17℃ to liquid water at 40℃. Using the formulas and three steps below, find the TOTAL amount of calories to do this. You should know the freezing and boiling point of water. Round all calories to the nearest whole number.
a. To heat the ice, it would take
b. To melt the ice, it would take
c. To heat the liquid water to 40℃, it would take
d. The total amount of heat necessary would be