5-Int Cast 2 - 3/14 Do Now
star
star
star
star
star
Last updated about 1 month ago
2 Nsɛmmisa
The amount of liquid water in the oceans and the amount of ice has changed over time. The graph shows the change over the past 30,000 years.
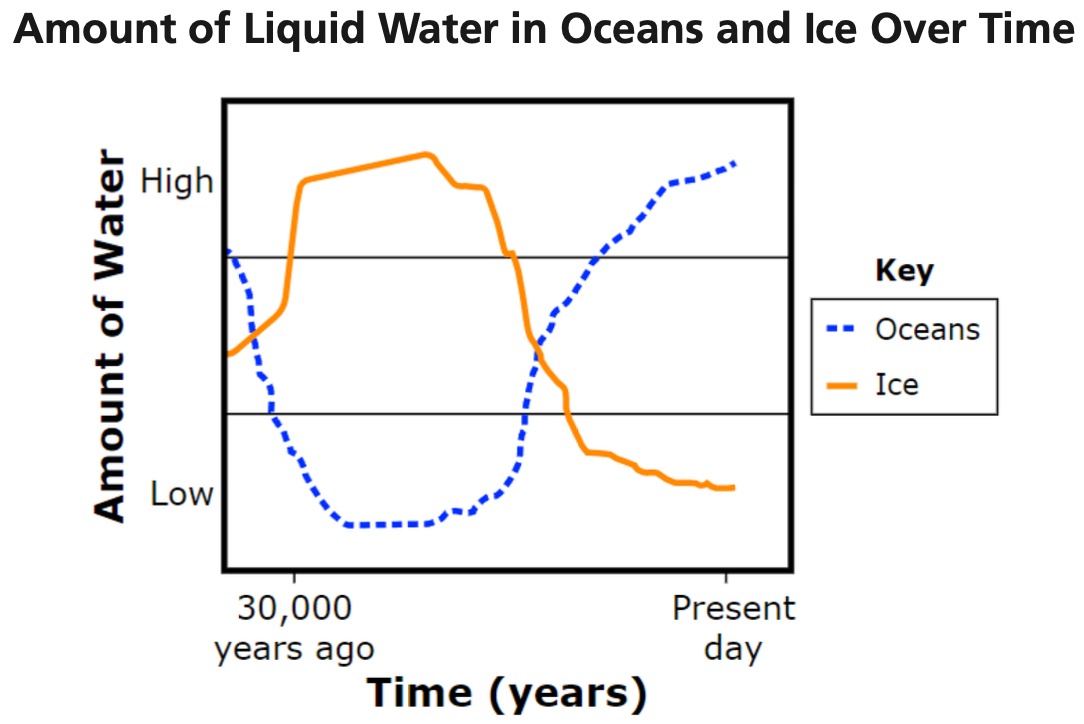
Which statement best describes the pattern shown in the graph?
Scientists claim that an increase in Earth’s average temperature was one factor that could have caused the pattern observed in the graph.
Select terms from the lists to complete the sentences.
If Earth’s average temperature keeps increasing some of the water found in glaciers could . Based on the graph, this means that the amount of may increase.