Electromagnetism
star
star
star
star
star
Posljednje ažuriranje over 2 years ago
8
Q1.
(b) The student puts opposite poles of two strong bar magnets near each other.
The diagram shows part of the magnetic field produced.
Only a small part of each magnet is shown on right.
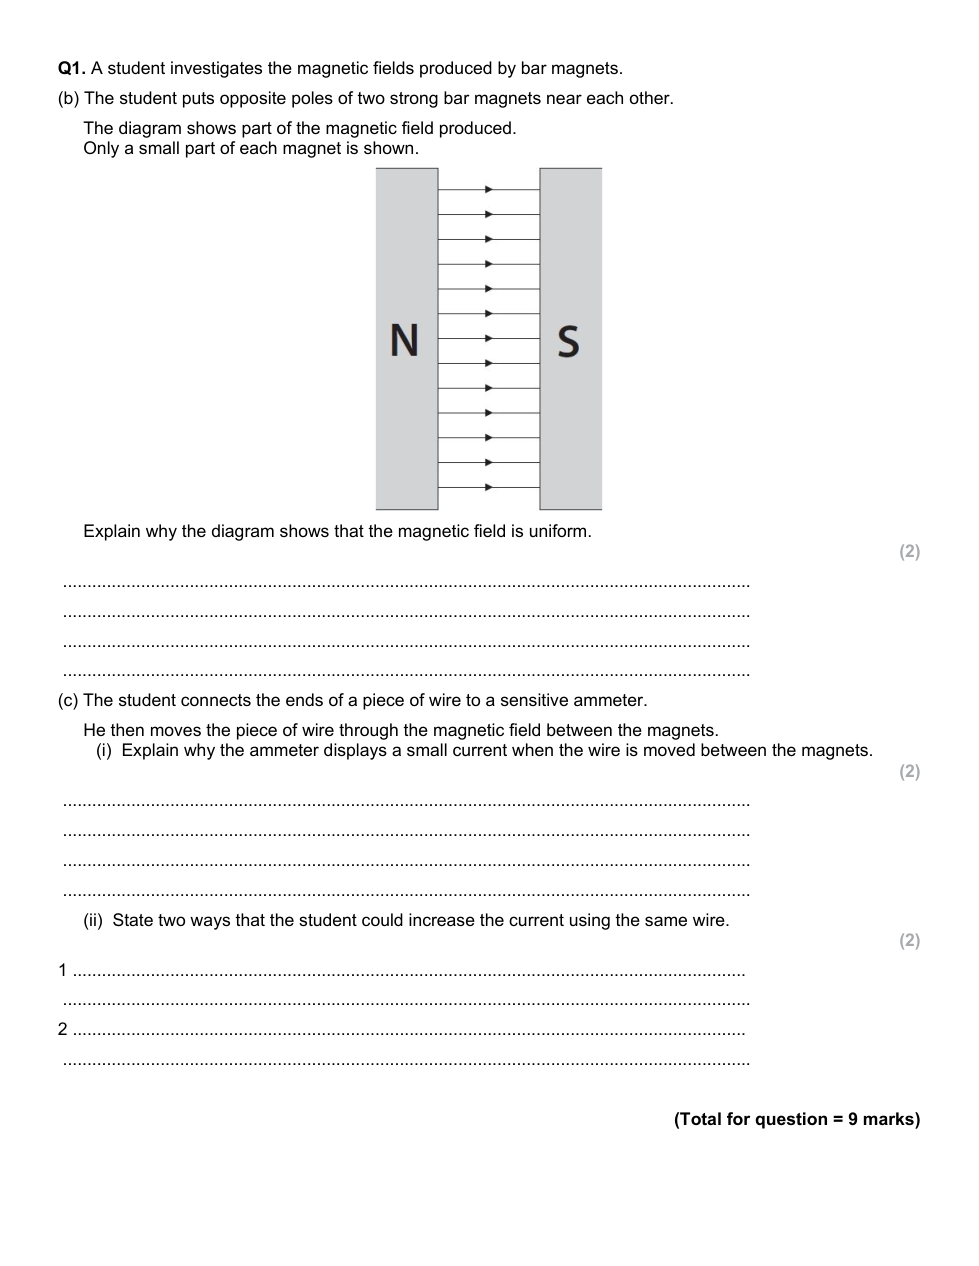
Explain why the diagram shows that the magnetic field is uniform.(2)
.............................................................................................................................................
.............................................................................................................................................
.............................................................................................................................................
.............................................................................................................................................
(c) The student connects the ends of a piece of wire to a sensitive ammeter.
He then moves the piece of wire through the magnetic field between the magnets.
(i) Explain why the ammeter displays a small current when the wire is moved between the magnets. (2)
.............................................................................................................................................
.............................................................................................................................................
(ii) State two ways that the student could increase the current using the same wire. (2)
1...........................................................................................................................................
2...........................................................................................................................................
(Total for question = 9 marks)
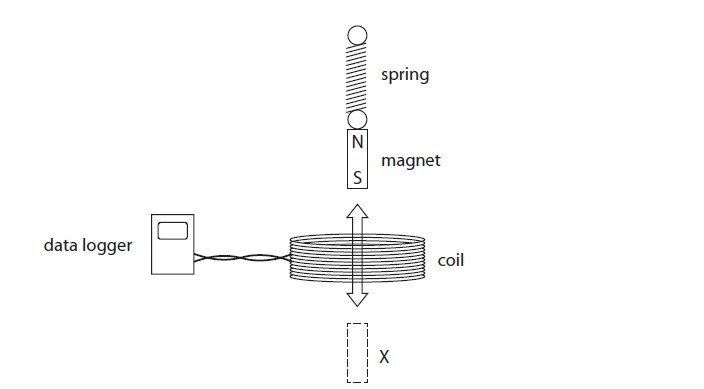
A student investigates how to produce a voltage.
He hangs a magnet from a spring, above a coil that is connected to a data logger. Image 1
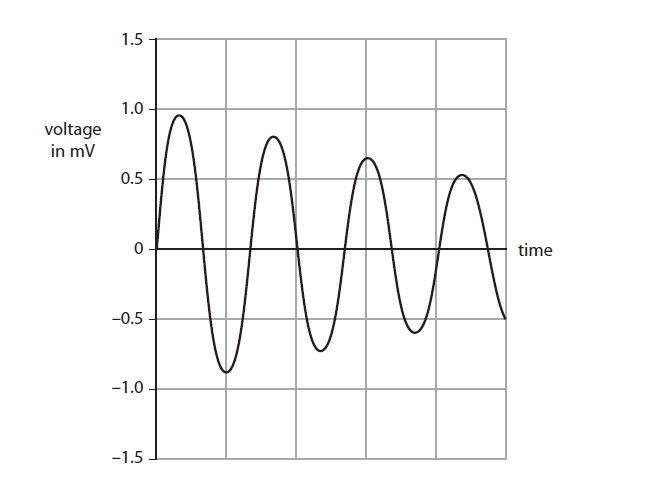
(a) The student pulls the magnet through the coil to X and then releases it.
The magnet moves up and down through the coil.
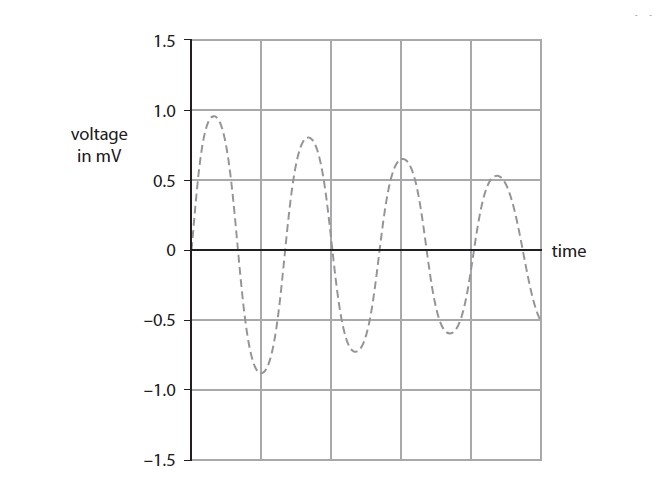
The data logger produces this graph of voltage against time. Image 2
(i) Explain why the data logger records a varying voltage.(2)
.............................................................................................................................................
.............................................................................................................................................
.............................................................................................................................................
.............................................................................................................................................
(ii) Which feature of the graph shows that the voltage is alternating?(1)
.............................................................................................................................................
.............................................................................................................................................
.............................................................................................................................................
(iii) Suggest why the voltage changes as shown by the graph.(2)
.............................................................................................................................................
.............................................................................................................................................
.............................................................................................................................................
.............................................................................................................................................
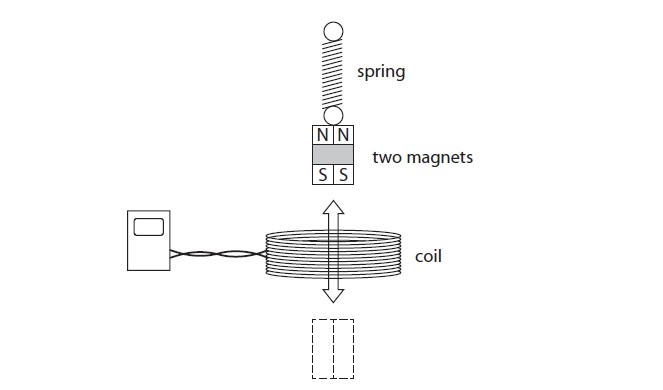
(b) The student repeats the experiment using two magnets taped together. Image 3
Compared to one magnet, these two magnets take a longer time to move up and down.
The dotted line on the grid shows the original graph for one magnet.
On the same grid image 4, sketch the graph that would be produced using two magnets.(3)
What happens when opposite poles of two strong bar magnets are placed near each other?
What is the result when similar poles of two strong bar magnets are placed near each other?
What could happen if the student uses weaker bar magnets?
What will happen to the magnetic field if the distance between the magnets increases?
Why does the data logger record a varying voltage?
Which feature of the graph indicates alternating voltage?
Why does the voltage change in the graph?
How would the graph change with two magnets?