Context 34 - Public Policy
star
star
star
star
star
Last updated about 2 years ago
20 Nsɛmmisa
Hyɛ no nsow a efi ɔkyerɛwfo no hɔ:
MMR resources
MMR resources
How many boys were “born” in your simulation?
What is the probability that a family under this simulation would have at least one boy?
Hint: Divide your number of families with at least one boy by 50.
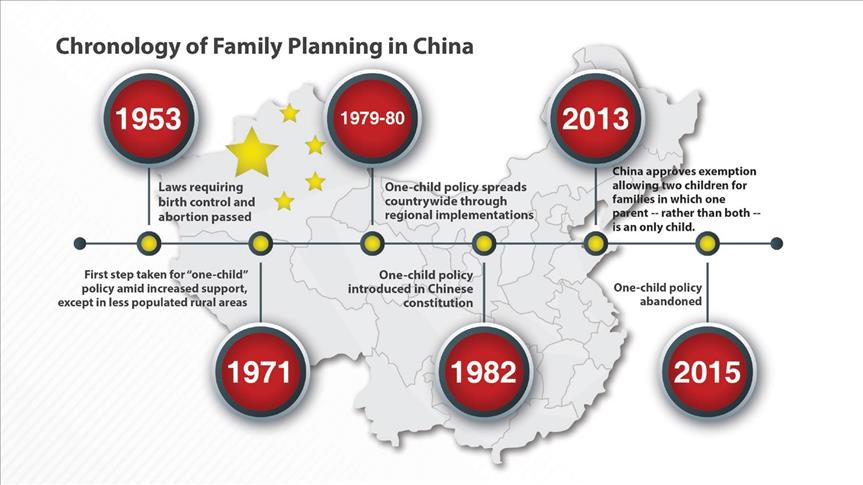
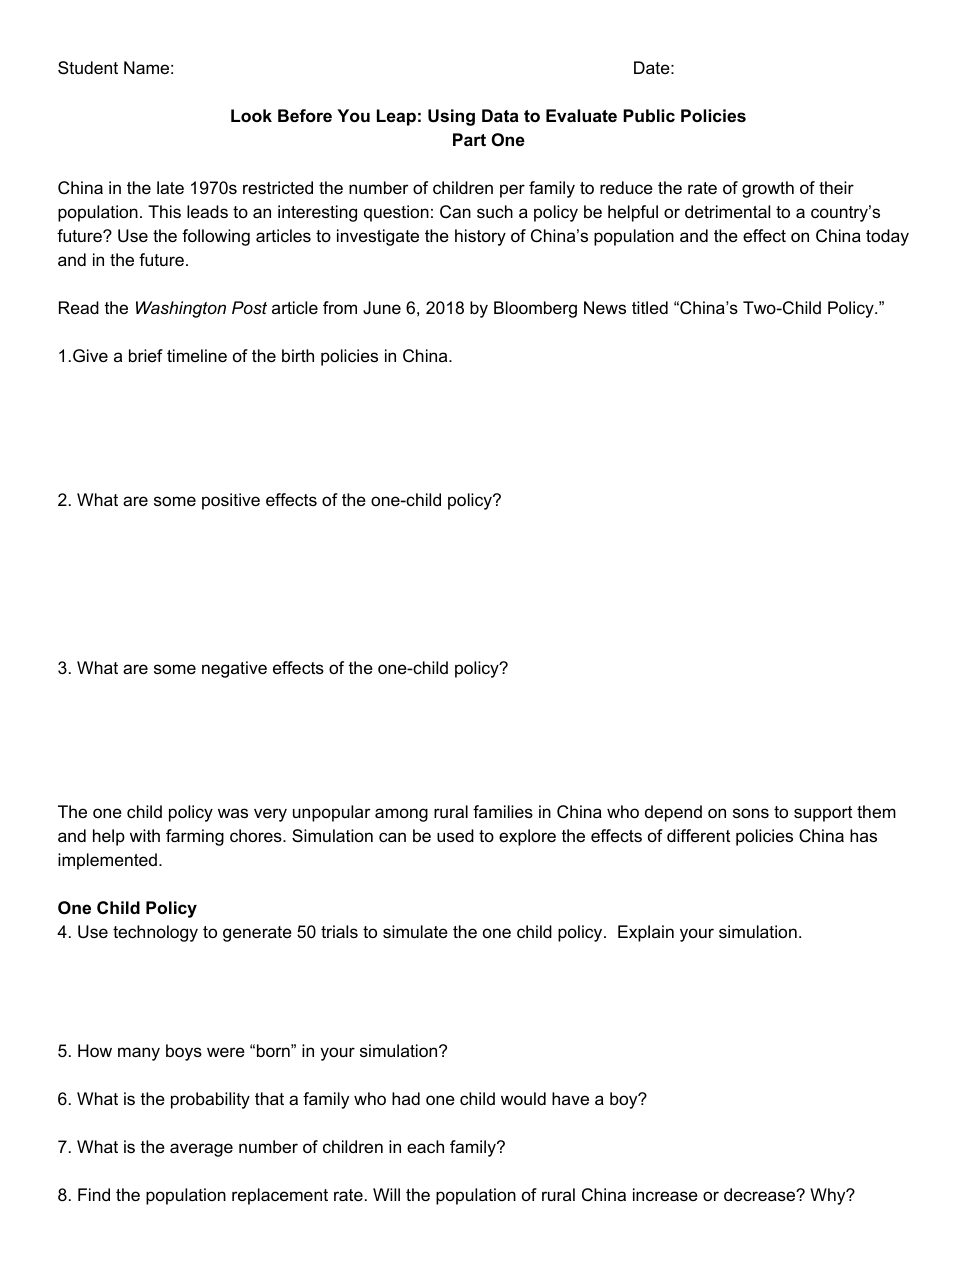
Using Google and the graphic above, give a brief timeline of the birth policies in China.
What are some positive effects of the one-child policy?
What are some negative effects of the one-child policy?
How many boys (heads) were “born” in your simulation?
How many girls (tails) were “born” in your simulation?
What is the probability that a family who had one child would have a boy?
Hint: Divide the number of boys by 50.
What is the average number of children in each family?
Find the population replacement rate. (you can Google this). Will the population of rural China increase or decrease if each family has 1 child? Why?
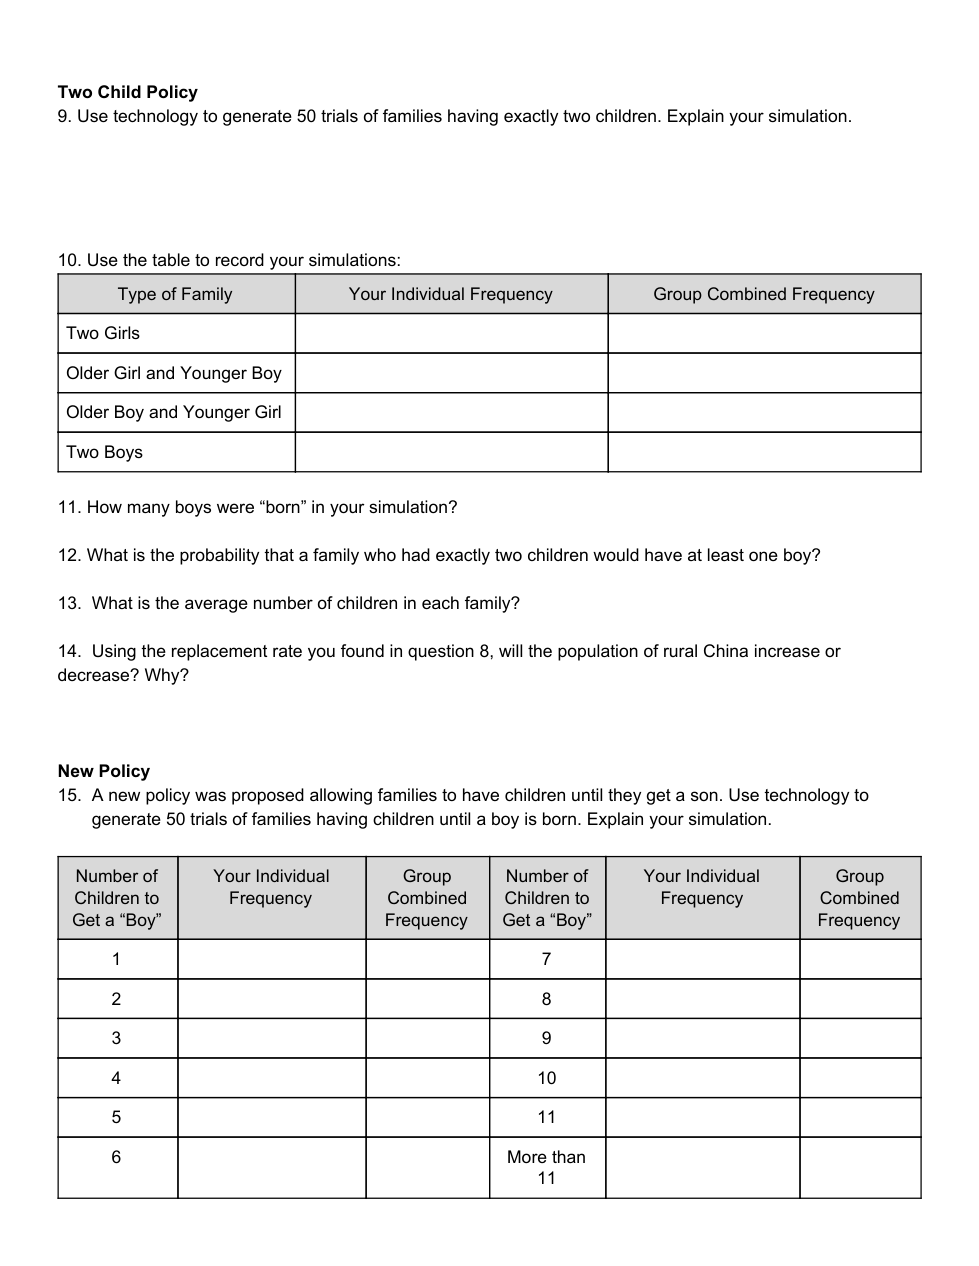
Record your results in the Individual Frequency column
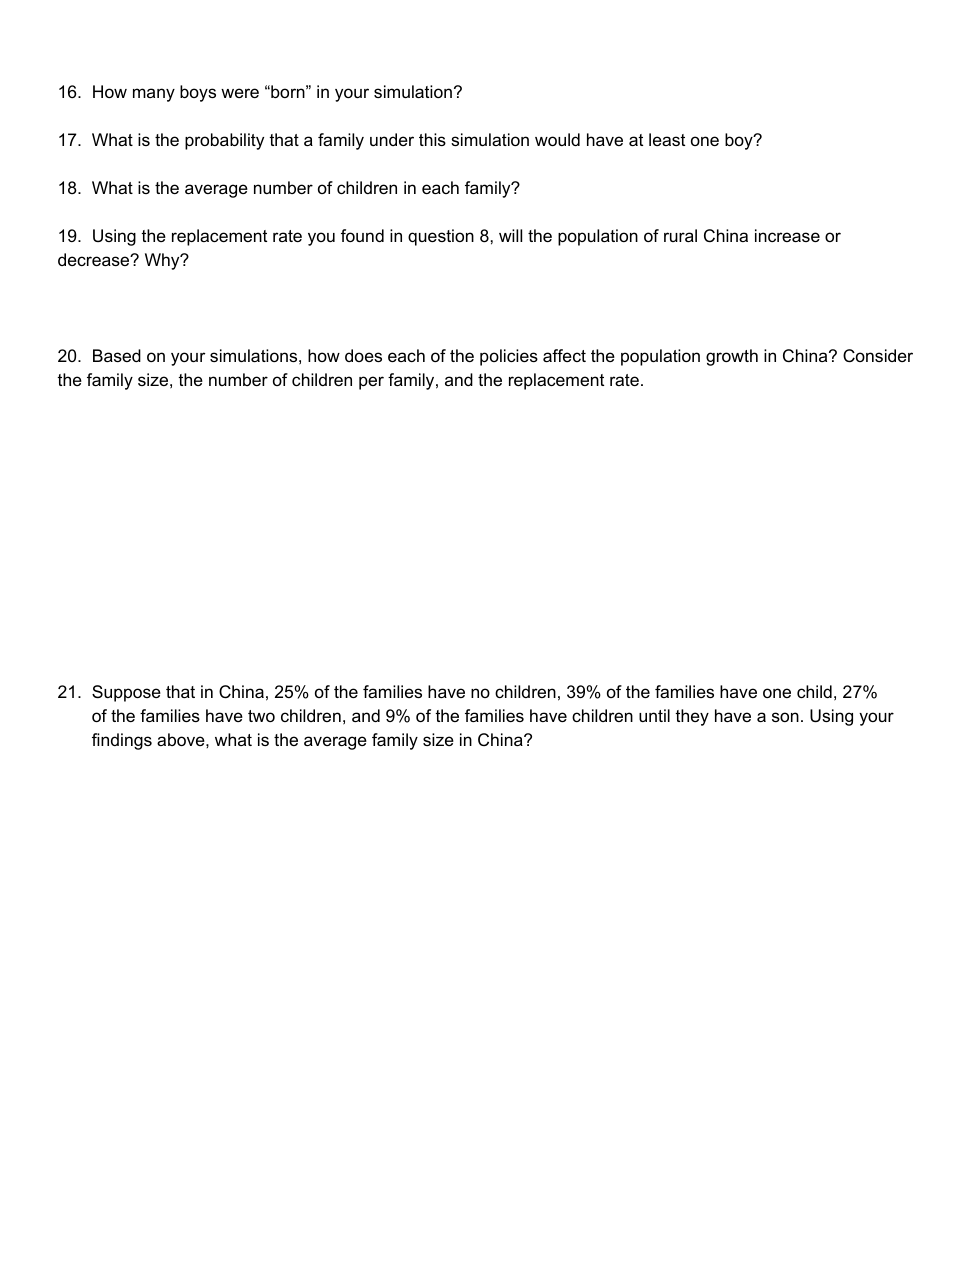
How many boys were “born” in your simulation?
What is the probability that a family who had exactly two children would have at least one boy?
Hint: Divide the number of families with at least one boy (G-B, B-G, B-B) by 50.
What is the average number of children in each family?
Using the replacement rate you found in question 8, will the population of rural China increase or decrease? Why?
A new policy was proposed allowing families to have children until they get a son. Use the following site to generate 50 trials of families having children until a boy is born.
https://www.statcrunch.com/applets/type3&coins
You'll flip the coin until a "heads" (boy) is recorded. Repeat this to simulate 50 families.
What is the average number of children in each family?
Using the replacement rate you found in question 8, will the population of rural China increase or decrease? Why?
Based on your simulations, how does each of the policies affect the population growth in China? Consider the family size, the number of children per family, and the replacement rate.
Suppose that in China, 25% of the families have no children, 39% of the families have one child, 27% of the families have two children, and 9% of the families have children until they have a son. Using your findings above, what is the average family size in China?