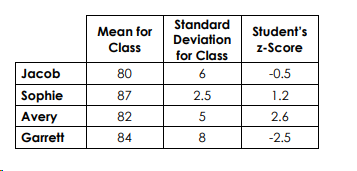
The table shows test data for four different classes and for one student in each class.
Find each student's grade. Round your answer to the nearest tenth.
Jacob:
Sophie:
Avery:
Garrett:
Show all work for full credit.
Mr. Statson gave a quiz and found it was normally distributed with a mean of 25 and a standard deviation of 10.
Find the z-scores fore each of the following values.
a) 40
b) 27
c) 6
Show work for your answers for full credit.
Round to one decimal place.
Calculate. Round to the nearest whole number, if necessary.
mean:
standard deviation:
Draw and label the normal distribution curve with the empirical rule.
68% of the students have a test score between
95% of the students have a test score between
What percentage of the students scored less than a 79?
What percent of the students scored between a 55 and 91?
Ms. Algebrian's test was normally distributed with a mean of 6 and a standard deviation of 1.5.
Find the z-scores for each of the following data values.
a) 4
b) 10
c) 7
Show all work for credit.
Round your answers to one decimal place.
The table shows test data for four different classes and for one student in each class.
Find each student's grade. Round your answer to the nearest tenth.
Jacob:
Sophie:
Avery:
Garrett:
Show all work for full credit.