Context 9 - Follow the Bouncing Ball Student Handout Day 2
star
star
star
star
star
Posljednje ažuriranje about 2 years ago
11
Napomena autora:
MMR Resources
1
1
MMR Resources
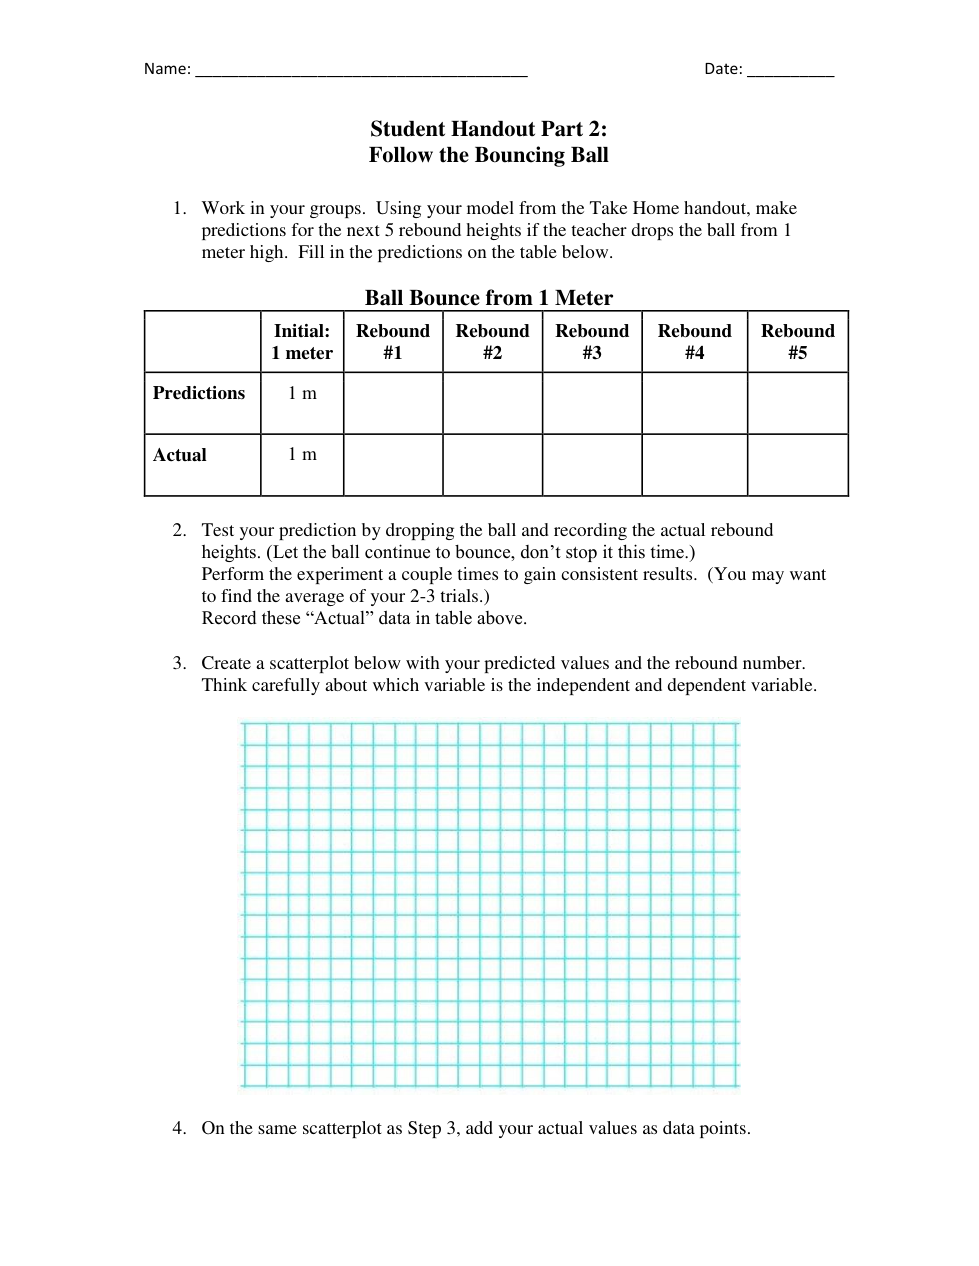
Click "Show your work" to fill out the table.
Hint: Use the "T" option on the left side menu to type your answers and use the "Scribble" option at the top of the menu to draw your responses.
Click "Show your work" to fill out the table.
Hint: Use the "T" option on the left side menu to type your answers and use the "Scribble" option at the top of the menu to draw your responses.

Click "Show your work" to fill out the table.
Hint: Use the "T" option on the left side menu to type your answers and use the "Scribble" option at the top of the menu to draw your responses.
Looking at the scatterplot with all the information from your table, what do you notice?
Looking at the scatterplot with all the information from your table, what do you wonder?
Looking at the scatterplot with all the information from your table, how do they compare?
Now you will use a graphing calculator to find regression equations using your actual rebound height data.
Open this link to access the regression calculator
(Note: We will use this calculator a lot this year so the class will likely need to discuss it. Here's a video)
Use the linear regression function to determine a model. Record the equation below.
Choose a different regression to fit your data. Record the equation here.
Which seems to model the data better - linear, or your choice? Explain why.
Why did you choose the nonlinear regression that you chose? Explain.
Use your algebraic models (linear and your choice) to predict what happens on the 8th rebound height. Which model fits the experiment better? Explain.