Context 34 - Public Policy Part 2
star
star
star
star
star
Posljednje ažuriranje about 2 years ago
15
Napomena autora:
MMR Resources
1
MMR Resources
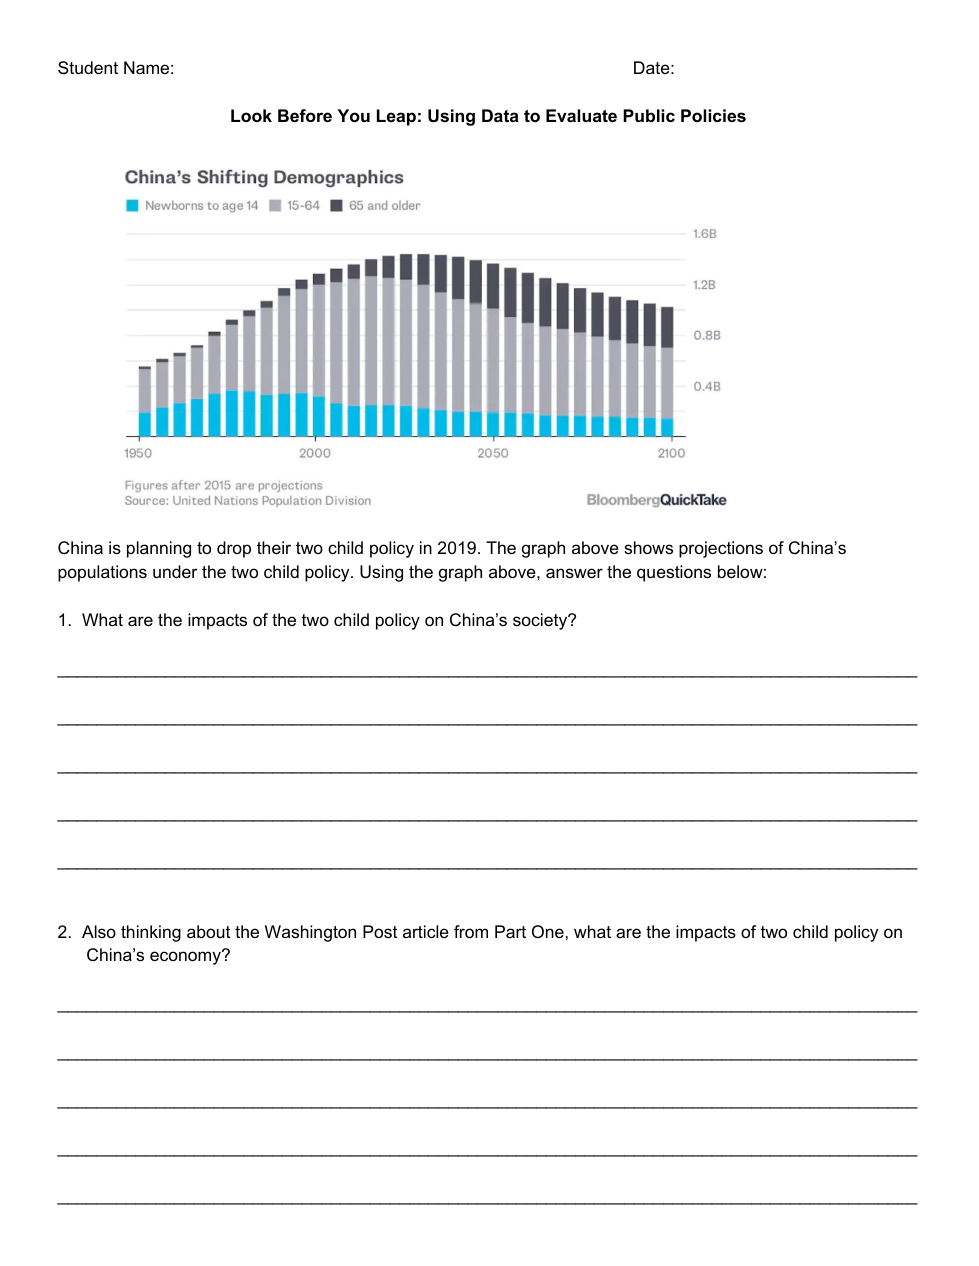
What are the impacts of the two child policy on China’s society?
Research online, what are the impacts of two child policy on China’s economy?

The age dependency ratio is a measure of the number of people aged zero to 14 and over the age of 65, compared with the total population aged 15 to 64.
This indicator gives insight into the number of people of non-working age, compared with the number of those of working age. Where do you see the age dependency ratio in the graph?
How has the one child policy enacted in 1979 and the two-child policy enacted in 2016 affected the age dependency ratio? Use the graph to support your answer.
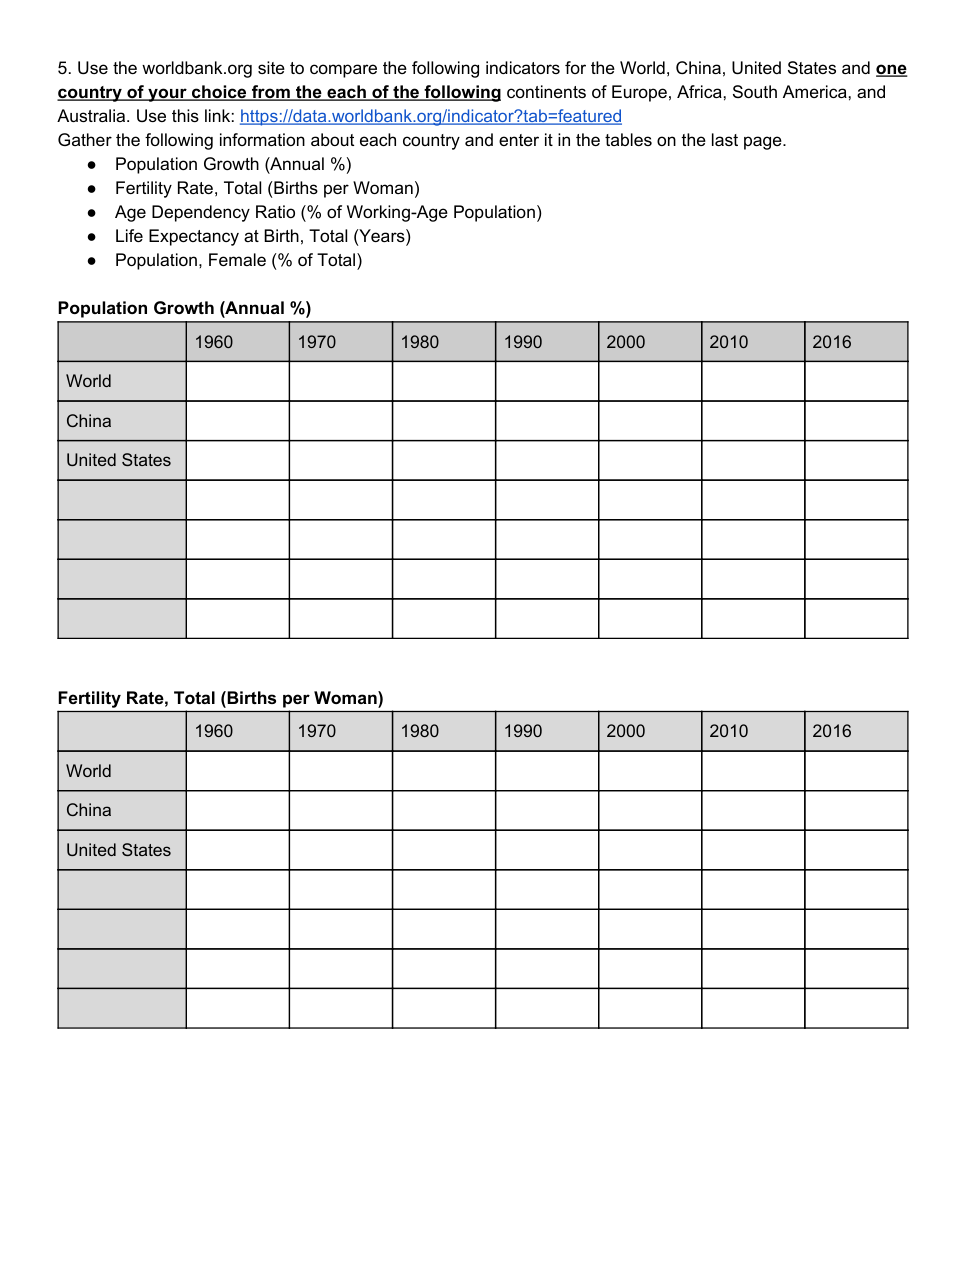
2) Hover over the graph to find the data for each year and fill in the table for Population Growth
2) Hover over the graph to find the data for each year and fill in the table for Fertility Rate (this is live births per woman)
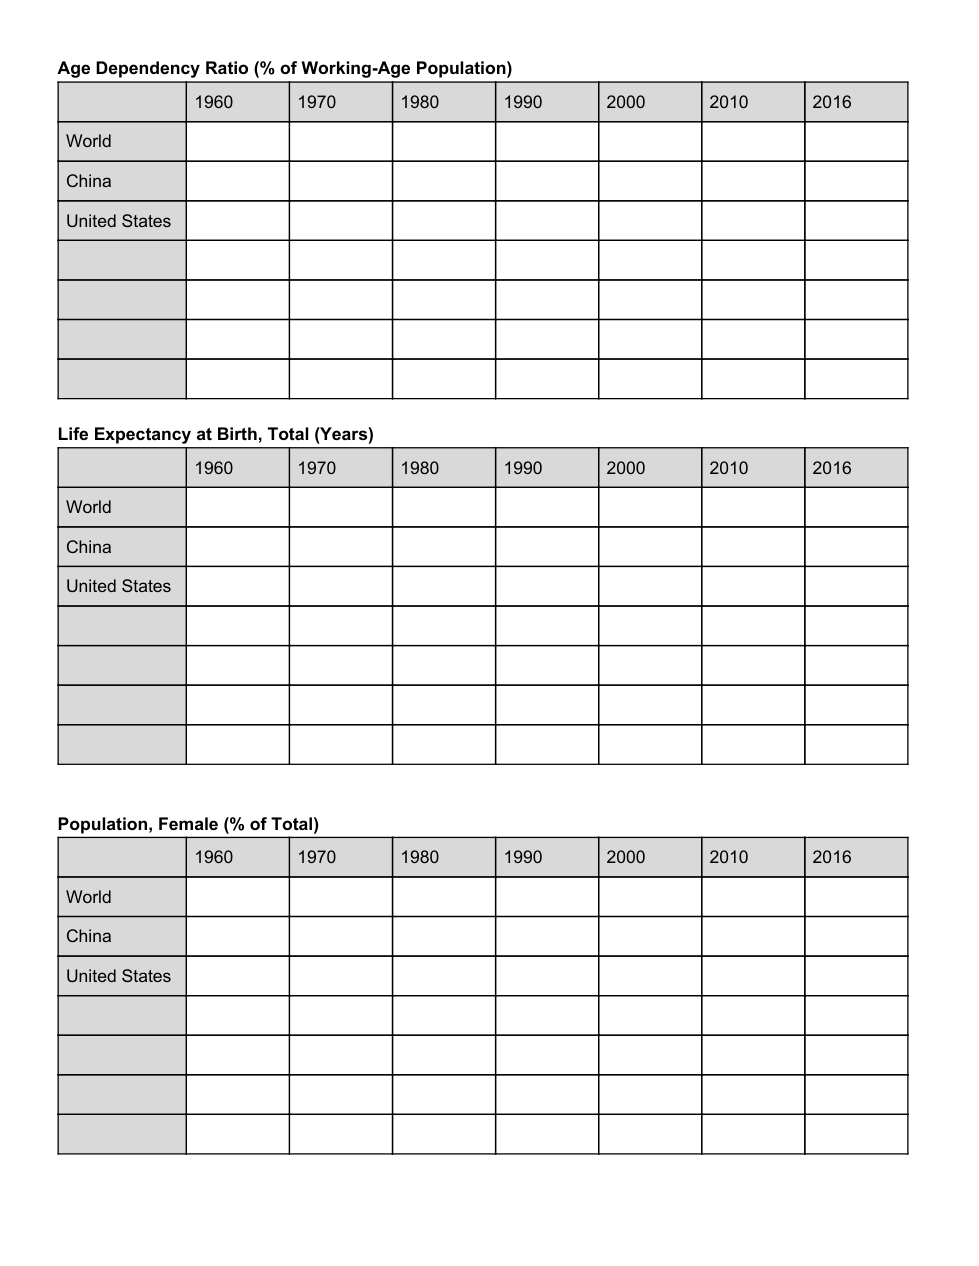
2) Hover over the graph to find the data for each year and fill in the table for Age Dependency Ratio (this is the number young and elderly per 100 working age adults)
2) Hover over the graph to find the data for each year and fill in the table for Life Expectancy
2) Hover over the graph to find the data for each year and fill in the table for Sex Ratio (this is the number of boys born per 100 girls)
Examine the information in the tables. What patterns do you notice? Are there similarities between countries? Are there differences between countries? What might cause these similarities and differences?

Are there relationships between Population Growth, Fertility Rate, Age Dependency Ratio, Life Expectancy at Birth, and the Female Population? What might explain these relationships?
Use the Population, Female (% of total) Table (see last page) to determine the difference between number of males and females in China for the years 1980 and 2016. Compare those numbers to the population of the United States. Why is representing the data in this manner more impactful than representing it as percent?
Refer back to question #3 for the definition of dependency ratio. Use all of the information that you have investigated and discussed above to determine an “ideal” dependency ratio for a country. How did you determine your ratio? Provide support for your answer.
What was the ultimate effect of China’s one child policy? Is China’s problem unique? Did they need it?

Does the United States have the same problem as China (decreasing birth rate, aging population, lower dependency ratio, and higher life expectancy)? What should the United States do about it? Support your answer using data from the table as well as relationships between the indicators.
