Log in
Sign up for FREE
arrow_back
Library
Copy of Interpreting Graphs (6/7/2024)
By Trevor Townsend
star
star
star
star
star
Share
share
Last updated almost 2 years ago
20 questions
Add this activity
14
15
zoom_in
1
1
1
2
3
4
5
6
zoom_in
1
1
1
1
1
1
7
8
9
10
11
12
13
zoom_in
1
1
1
1
1
1
1
Question 14
14.
Question 15
15.
16
17
18
19
20
zoom_in
1
1
1
1
1
Question 1
1.
Question 2
2.
Question 3
3.
Question 4
4.
Question 5
5.
Question 6
6.
Question 7
7.
Question 8
8.
Question 9
9.
Question 10
10.
Question 11
11.
Question 12
12.
Question 13
13.
1
2
3
4
21
22
25
29
Question 16
16.
Question 17
17.
Question 18
18.
Question 19
19.
Question 20
20.
Breast Cancer
Lung Cancer
Skin ( basal)
Skin (melonoma)
Breast Cancer
Lung Cancer
Skin ( basal)
Skin (melonoma)
Breast Cancer
Prostate Cancer
Skin ( basal)
Skin (melonoma)
Lung Cancer
Skin ( basal)
Skin (melonoma)
Colon Cancer
180
180000
40
140000
Line graph
Pie graph
Bar graph
5%
10%
15%
25%
Fraser Fir
White Pine
Nible Fir
Colorado Blue Spruce
5%
10%
15%
25%
Line graph
Pie graph
Bar graph
Line graph
Pie graph
Bar graph
28 cm
30 cm
32 cm
42 cm
3 hours
6 hours
9 hours
12 hours
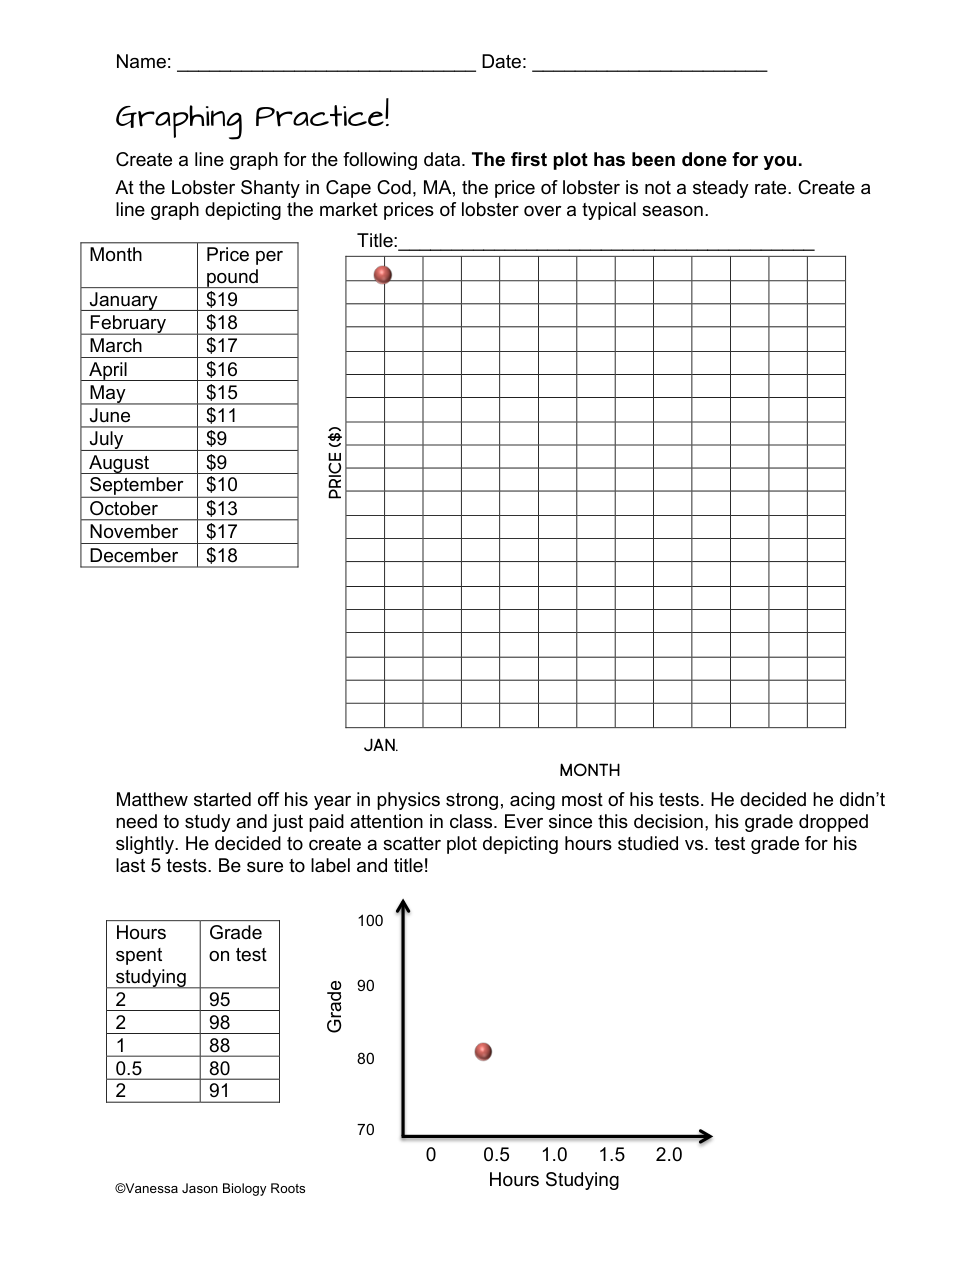
What is the graph showing from January to May?
Increase
Decrease
Stay the same
What is the graph showing from May to July?
Increase
Decrease
Stay the Same
What is the graph showing from July to August?
Increase
Decrease
Stay the same
What is the graph showing from July to December?
Increase
Decrease
Stay the same
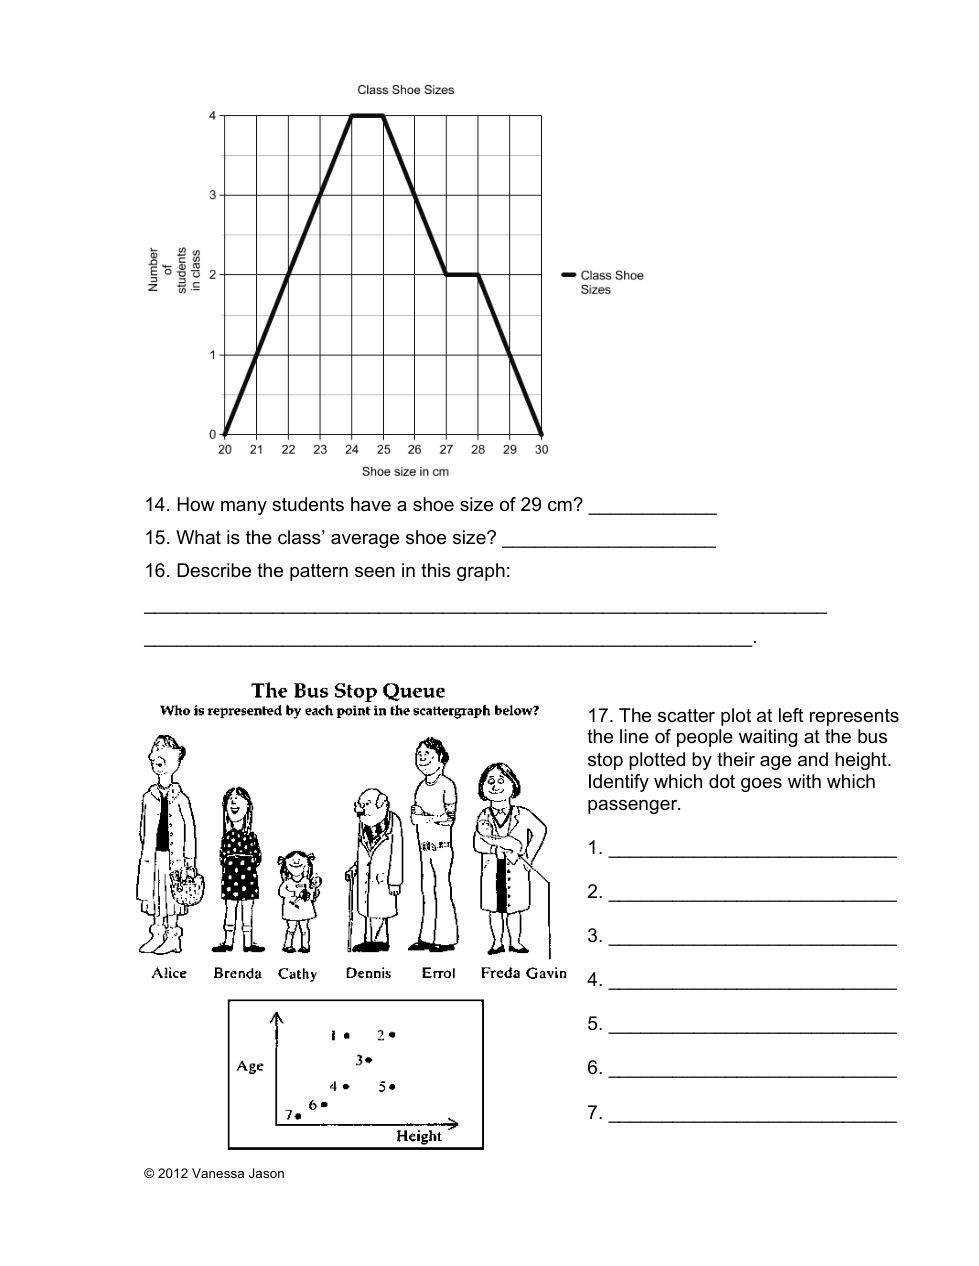
What is the trend you notice between grade and hours studying?
I don't know I didn't do my graph
The more time spent studying the lower grade
The more time spent studying the higher the grade
There is no correlation between the two