A student draws a model of Earth's orbit around the Sun to demonstrate seasonal changes in the Northern Hemisphere.
Drag the name of each season into the correct box to complete the model.
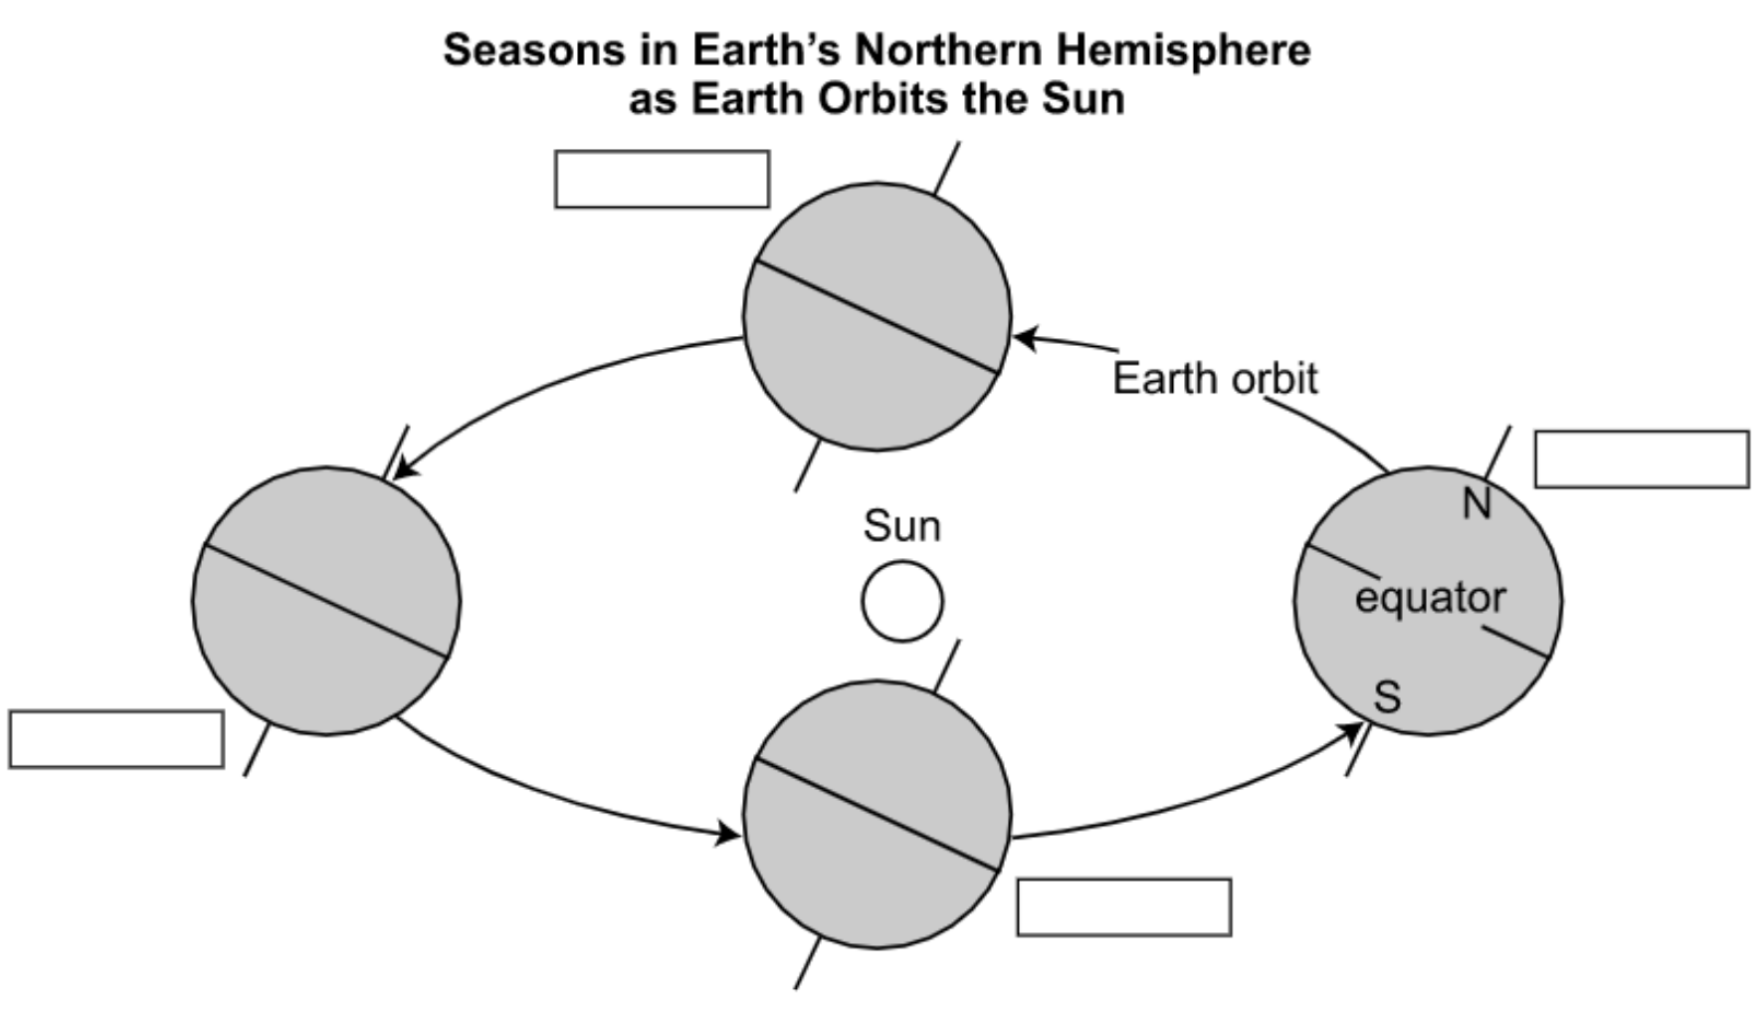
Drugi mogući odgovor:
fall
spring
winter
summer
A student draws a model of Earth's orbit around the Sun to demonstrate seasonal changes in the Northern Hemisphere.
Drag the name of each season into the correct box to complete the model.
The data table lists information about the planets in our solar system.

Based on the data, select the two statements that best describe the planets in our solar system.
A student is building a scale model of the solar system. The table below shows the distance between the Sun and each planet in our solar system. In the student's model, one astronomical unit (AU) is equal to one meter.

The asteroid belt in our solar system is between the inner and the outer planets. Select the range of meters from the Sun in which the asteroid belt is located in the student's model.
The diagram represents the geologic profile of an area.

Which statement best describes the formation of rock in this geologic profile area?
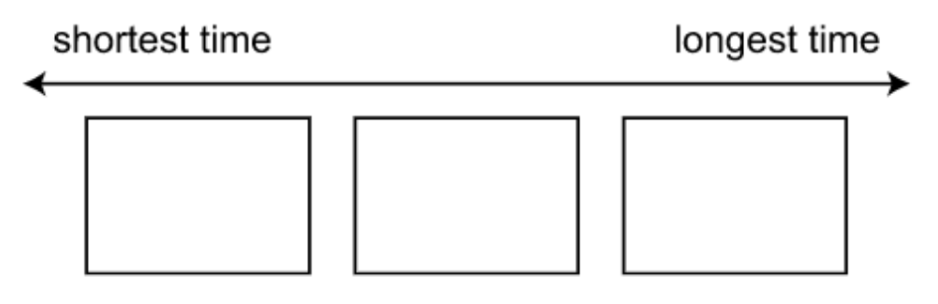
The table provides some information about how some Earth features formed.

Drag the names of the features into the diagram to compare the amount of time each feature took to form.
Many scientists theorize that the continents were once joined together. Select the two pieces of evidence that scientists use to support this theory.
Biochemical cycles, such as the carbon cycle, affect the flow of energy on Earth.

Based on the diagram, what role do animal waste and dead animals play in providing energy in this cycle?
A student uses crayons to model processes in the rock cycle.
Drag the process represented by each step into the model.

Coal forms over time from the remains of plants. Oil forms from the remains of tiny organisms that live in salt water. The map shows some of the geologic features in an area many years ago.

Based on the information in the map, use the drop-down menus to predict where coal and oil would most likely be found in this location at the present time.
Coal would be found in the , and oil would be found in the .
A student wants to develop a model to illustrate how Earth's magnetic field is produced. Which pair of statements describes characteristics that the student must include in the model?
The model shows how wind patterns near the sea change between daytime and nighttime.

What is the most likely factor that causes the change in these wind patterns?
The two graphs below show the population growth and the usage of fresh water in the United States.

Use the drop-down menus to correctly complete the analysis of the graphs.
After 1980, the volume of groundwater and other fresh water withdrawn as the U.S. population . This means that water use became efficient after 1980.
A highway in northern Alabama has had increased vehicle traffic. Reductions in organism populations have been observed in a nearby stream.
Select the two methods that would be most useful for a scientist who wants to study how the highway traffic can affect the stream.
Select the names of the two planets that are closest together in the student's scale model.