Displacement and Velocity Practice Honors
star
star
star
star
star
Last updated about 2 years ago
15 Nsɛmmisa
1
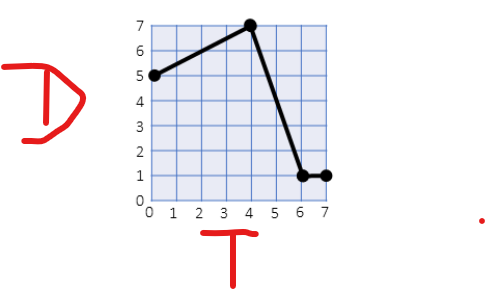
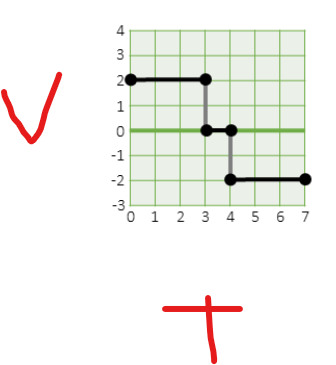
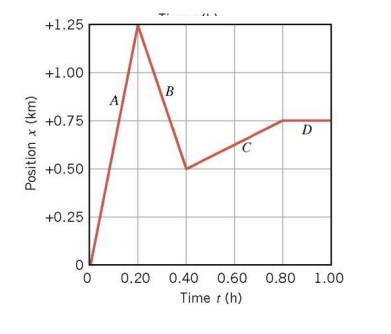
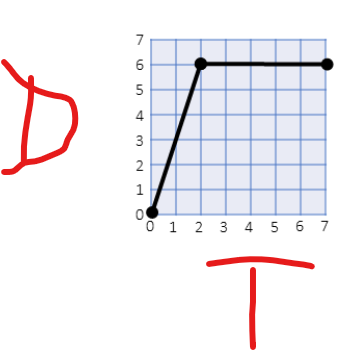
Draw the velocity vs time graph to match the displacement vs time graph on the left.
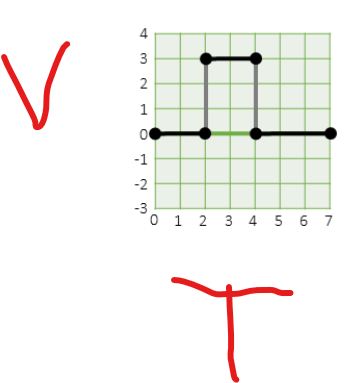
Draw the velocity vs time graph to match the displacement vs time graph on the left.