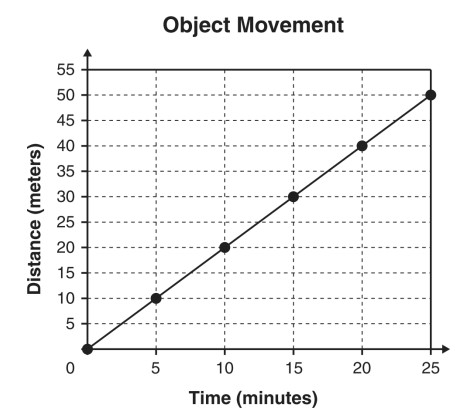
Log in
Sign up for FREE
arrow_back
Library

Honors Velocity and Displacement Quiz

star
star
star
star
star
Last updated almost 2 years ago
15 questions
1
1
1
1
1
1
1
1
Question 1
1.

Question 2
2.

1
Question 4
4.

1
1
Question 7
7.

1
Question 9
9.

Question 10
10.

1
Question 12
12.

Question 13
13.

1
1
Which of the following represents the velocity of a moving object?
40 m
40 m/s north
40 m north
40 m/s
An athlete can run 9 kilometers in 1 hour. If the athlete runs at that same average speed for 30 minutes, how far will the athlete travel?
18 kilometers
3.3 kilometers
9 kilometers
4.5 kilometers
Question 3
3.

An elevator in an office building completed the following trips: 

1. 1st floor to 8th floor 
2. 8th floor to 4th floor 
3. 4th floor to 13th floor

The distance between each floor of the office building is 3.0 m.

Which table shows the total distance traveled and displacement of the elevator?
Question 5
5.

Question 6
6.

How much time is required for a bicycle to travel a distance of 100 m at an average speed of 2 m/s ?
100 s
50 s
0.02 s
200 s
Question 8
8.

Which of the following must be included with magnitude to represent a vector?
units
mass
speed
direction
Which of the following is an example of a vector quantity?
An object has a mass of 10.5 kg.
A student walks 2.0 km north.
A 1.0 kg object moves at 18 m/s.
A ball has an instantaneous speed of 15 m/s.
Question 11
11.

An object moves away from a motion detector with a constant speed. Which time vs distance graph best represents the motion of the object?
Which pair of graphs represent the correct relationship between displacement and the velocity of a moving object?
Question 14
14.

Question 15
15.

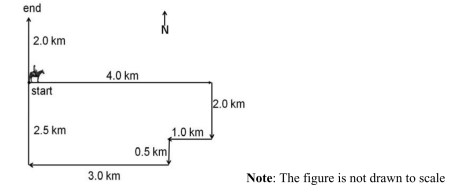
A rancher surveyed his property to make sure there were no breaks in his fence. He rode his horse around his entire property and then ended at home, as shown in the figure to the left. It took him 5 hours to complete this job from start to end.

What was the rancher's average velocity?
0.9 km/h North
0.4 km/h North
2.6 km/h North
3.0 km/h North
Based on this graph, which is constant?
velocity
time
position
displacement
The graph represents the motion of a car moving linearly.

When is the car moving backwards?
0 s to 10 s
20 s to 40 s
40 s to 50 s
50 s to 60 s
The graph to the left shows the movement of an object at several points in time.

What is the average speed of the object?
25 m/min
50 m/min
2 m/min
0.5 m/min
The graph to the left shows the distance traveled by an object over 100 seconds.

What is happening between X and Y?
The object stopped moving.
The object changed directions.
The object increased its speed.
The object decreased its speed.
A student records the position of a car every second for a period of time and plots the displacement and time graph to the left.

Illustrated below is the change in position of a car every second. Which observation of an object moving from left to right did the student record?
The graph to the left shows the speed of a vehicle over time.

How far did the vehicle travel during the first two seconds?
0.2 m
20 m
10 m
5 m