Match the measures of center to the corresponding part of the diagram.
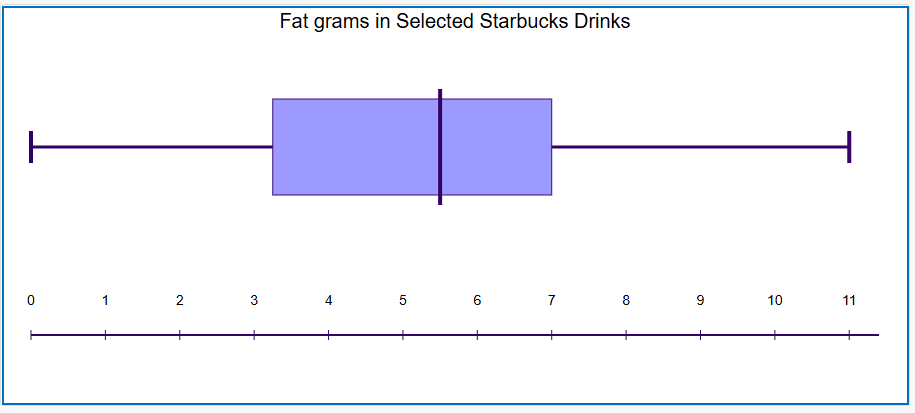
Mmuae Afoforo a Wobɛpaw:
Minimum
Q₁
Q₃
Maximum
Median
Below are various prices for the Nintendo Switch 2.
Find the measures of center of all the prices. You can ignore the any shipping charge when calculating the measures of center.
Mean (average)=
Lower Quartile (Q₁) =
Median (Q₂)=
Upper Quartile (Q₃)=
Mode(s)=
Range=
IQR (Q₃-Q₁)=
(Round Your answers to the nearest the nearest cent)
Match the measures of center to the corresponding part of the diagram.
Select the data needed to find the IQR of this data.
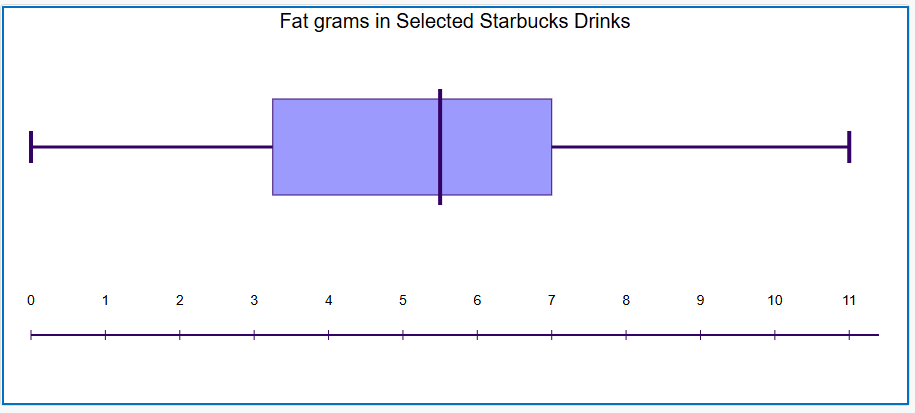
Select the quartile that splits the top 25% from the rest of the data.
Use your data from question 1 to answer the following questions about your data.
25% of the selected Switch 2 prices are greater than $
What percent of the selected Switch 2 prices are more expensive than $650?
A health club recorded the number of minutes that various members spent on the treadmill:
{90, 86, 81, 62, 44, 93, 100, 75, 62, 57}
1) Find the measures of center
Mean=
Mode =
Q₁=
Median=
Q₃=
(Round your answer to the nearest tenth)
2) Use the data to create stem and leaf plot.
3) Use the measures of center to create a box and whisker plot.