Put the steps in the order you would solve the problem.

Put the steps in the order you would solve the problem.
Put the steps in the order you would solve the problem.
Simplify.
=
Put the steps in the order you would solve the problem.
x =
x =
x =
r =
Graph
Graph
Graph
Write in slope intercept form. Then, graph.
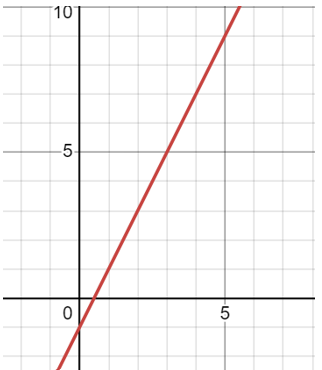
What is the slope of this line?
m =
What is the slope of this line?
m =
What is the slope of this line?
f(4) =
h(1) =
Click on the point that corresponds to f(3). That is, what point on the graph has an x-value of 3?

Click the point that corresponds to f(x) = 1. That is, what point on the graph has a y-value of 1?
Given the table,
find f(0) =
Given the table,
f(-9) =
Given the table,
Solve f(x) = 5, x =
Simplify. Type your answer in standard form.
=
Simplify. Type your answer in standard form.
=
Simplify. Write your answer in standard form.
=
Simplify. Type your answer in standard form.
=
Type your answer in standard form.
=


