Scientists have many tools that they use to collect data accurately. However, it is also important to question whether the data is reasonable, or if it makes sense. Sometimes, errors can occur when data is measured or calculated. For example, a value could be measured in a different unit than was used in previous measurements. Thus, scientists can conclude that a set of data is either reasonable or anomalous. Reasonable data is data that would be expected in a data set. Anomalous data is data that is not expected in a data set.
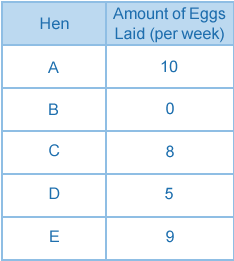
For instance, a group of scientists measured the mass of several snails to see if mass affected the speed at which they traveled. They recorded their data on a chart. Snail D has a mass of 0.0291 grams, which does not fit with the rest of the data set. Most likely, this measurement was recorded in kilograms, which is a different unit than the rest of the data. Thus, Snail D’s data is not reasonable, and it is anomalous.
A scientist should investigate anomalous data. For example, data that was collected improperly could be thrown out or measured again. If Snail D were reweighed and had a mass of 29.1 grams, it could be determined that the data set is reasonable. Some or slight variation in a data set makes sense.
Required
1 point
1
Question 1
1.
Which of the following could be sources of anomalous data?
Required
1 point
1
Question 2
2.
Click on the anomalous data in the data set.
Required
1 point
1
Question 3
3.
This data is reasonable.
Required
1 point
1
Question 4
4.
Which of the following can scientists do with data?
How do scientists organize data? Similar to mathematicians, scientists also use tables to organize the data that they collect from experiments. Data tables often have two columns, each representing a variable in the observation. Normally, the independent variable is in the leftmost column, and the dependent variable is in the rightmost column. If there is more than one dependent variable, additional variables are located in additional columns to the right of the independent variable. An independent variable is the variable that is manipulated, meaning controlled or purposefully changed, during an experiment. A dependent variable is the variable that changes in an experiment as a result of changing the independent variable.
For example, a student wants to test if adding more weight into her backpack would increase or decrease the time it takes for her to bike home from school. The independent variable is the amount of weight that she adds to her backpack because this is purposefully changed throughout the experiment. The dependent variable is the amount of time it takes her to bike home. The amount of time it takes her to bike home will change as a result of the changing weight in her backpack.
Required
1 point
1
Question 5
5.
George is measuring how many cups of cold lemonade he sells during the summer. As each cup is sold, he measures the total number of cups sold and the temperature outside. Identify the independent and dependent variable.
Other Answer Choices:
Dependent Variable (DV)
Independent Variable (IV)
Checking for Understanding:
1. Data that makes sense is reasonable, and data that does not make sense is anomalous.
2. Scientists use tables to organize the data they record from experiments.
3. An independent variable is the variable that is manipulated during an experiment.
4. A dependent variable is the variable that changes in an experiment as a result of changing the independent variable.
Scientists can organize data on graphs as well. Graphs can reveal trends or patterns in sets of data. There are several types of graphs, each of which shows different trends in data. Line graphs, scatter plots, bar graphs, and pie charts are each used to show different patterns in data sets. A line graph is a graph that shows how the dependent variable changes in response to an independent variable.
Required
1 point
1
Question 6
6.
Drag each type of variable to the appropriate axis in the line graph.
Other Answer Choices:
Dependent Variable (DV)
Independent Variable (IV)
Required
1 point
1
Question 7
7.
Jack observes that the mass of a skater affects how fast the skater travels on a skateboard. He organizes his data on a line graph. Which of the following line graphs represents his data?
Required
1 point
1
Question 8
8.
Which of the following are reasons why scientists use line graphs?
Check for Understanding:
1. Graphs can reveal trends or patterns in sets of data.
2. A line graph is a graph that shows how the dependent variable changes in response to an independent variable.
Line graphs can show two types of relationships: linear and nonlinear. A linear graph is a line graph in which the data points fall along a straight line. On linear graphs, the value of y always increases or decreases by the same value, in relation to x.\
The relationship between the independent and dependent variable does not always produce a straight line. A nonlinear graph is a line graph in which the data points do not fall along a straight line. Sometimes, a smooth curve, rather than a straight line, links the data points that are plotted on a nonlinear graph.
Line graphs allow people to make predictions and analyze trends. For example, Holly can look at the data from her knitting company and analyze when she must make the most scarves for her customers. Looking at this nonlinear graph can help Holly better plan out her resources and time for the next year.
Required
1 point
1
Question 9
9.
Which graph is linear and which graph is nonlinear?
Other Answer Choices:
nonlinear
linear
Check for Understanding:
1. Line graphs can show two types of relationships: linear and nonlinear.
2. A linear graph is a line graph in which the data points fall along a straight line.
3. A nonlinear graph is a line graph in which the data points do not fall along a straight line.
Required
1 point
1
Question 10
10.
By using the graph, what is the relationship between the distance and the time Emily walk's?
Scientists can also use scatter plots to represent data. A scatter plot is a graph that has plotted points and is used to show the relationship between two variables. Scatter plots, like line graphs, have a horizontal x-axis that usually represents the independent variable and a vertical y-axis that typically represents the dependent variable.
Required
1 point
1
Question 11
11.
Which line of best fit is closest to the data points?
Required
1 point
1
Question 12
12.
Predict the sales profit when 9 candy bars are sold.
Check for Understanding:
1. A scatter plot is a graph that has plotted points and is used to show the relationship between two variables.
Some charts, such as bar charts and pie charts, are used to categorize data. These charts allow scientists to compare two or more categories of data to one another. A bar chart is used to display data that is organized in distinct categories.
A pie chart is a circular chart that is divided into slices that show the numerical proportion of each category. Click the buttons to learn more about pie charts.
Required
1 point
1
Question 13
13.
Which months of the year have the smallest and greatest monthly rainfall amount?
Other Answer Choices:
July
May
April
June
Required
1 point
1
Question 14
14.
Compare and contrast bar charts and pie charts.
Other Answer Choices:
used to compare the proportion of data in each categories
can represent two or more categories of data
used to compare the exact amount of data in each category
Check for Understanding:
Pie charts and bar charts can be used to compare data composed of two or more categories:
• Bar charts are used to display data that is organized in distinct categories.
• Pie charts are circular charts that are divided into slices that show the numerical proportion of each category.
Required
1 point
1
Question 15
15.
Reasonable data is __________.
Required
1 point
1
Question 16
16.
Anomalous data is __________.
Required
1 point
1
Question 17
17.
What is a line graph?
Required
1 point
1
Question 18
18.
What is a linear graph?
Required
1 point
1
Question 19
19.
What is a nonlinear graph?
Scientists use graphs to analyze and make predictions about data. Data that makes sense within a set is reasonable, while data that does not make sense is anomalous.
A line graph shows how the dependent variable changes in response to an independent variable over time.
A scatter plot is a graph used to show the relationship between two sets of data.
Pie charts and bar charts can be used to compare data composed of two or more categories. A bar chart is a chart used to display data organized in distinct categories. A pie chart is a circular chart that is divided into slices to show the numerical proportion of each category.
Required
1 point
1
Question 20
20.
Which of the following data tables represents the line graph above?
Required
1 point
1
Question 21
21.
Jasmine creates a graph of how many times she eats at restaurants versus how much money she spends each month. Which of the following statements are true?
Required
1 point
1
Question 22
22.
Which of the following correctly describes the highlighted points on the graph below?
Required
1 point
1
Question 23
23.
The bar chart below shows the average amount of sunlight in Reykjavik, Iceland, for the year. On average, __________ has the most sunlight per day, while __________ has the least amount of sunlight per day.