(Level 2) Which trend line is the best model of the data? Explain.

(Level 2) Which trend line is the best model of the data? Explain.
![]()
(Level 2) Which trend line is the best model of the data? Explain.
![]()
(Level 2) Which type of association does the scatter plot show?
![]()
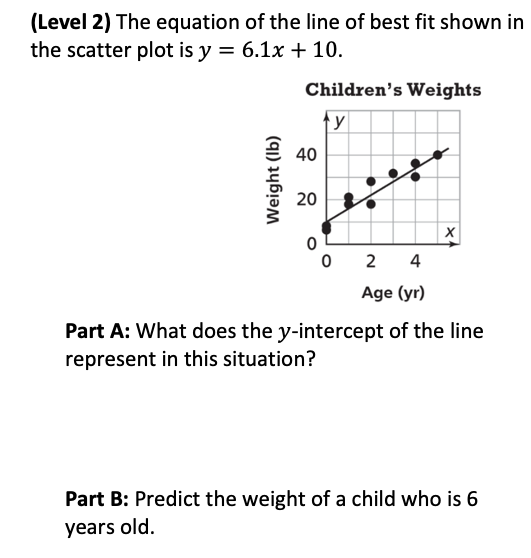
What does the y-intercept of the line represent in this situation?
Predict the weight of a child who is 6 years old.
(Level 2) Which scatter plot best represents the data in the table?

(Level 3) The table shows the number of people and the total cost of their movie tickets at various movie theaters. Complete the scatter plot in the workspace to represent the data. Be sure to use appropriate scales, labels, and choice of y-axis.

Draw a trend line on the scatter plot in the workspace.
Explain how your line fits the data.
(Level 3) The equation for the trend line that shows the relationship between the amount of sleep Aria gets the night before a test and her test scores is
(Level 3) The scatter plot shows the day of a month and the amount of rain in a city. Select all statements that apply.

(Level 3) The scatter plot shows the number of passengers at a major airport over a 15-year period from the year 2000. About how many passengers traveled through this airport in the year 2011?
(Level 4) Describe a real situation that will show a negative linear association. Explain your reasoning.
(Level 4) Which scatter plot most likely represents the relationship between a city's population density and the average rent for a 1-bedroom apartment? Explain.
