1
Identify the graph that represents a proportional relationship.
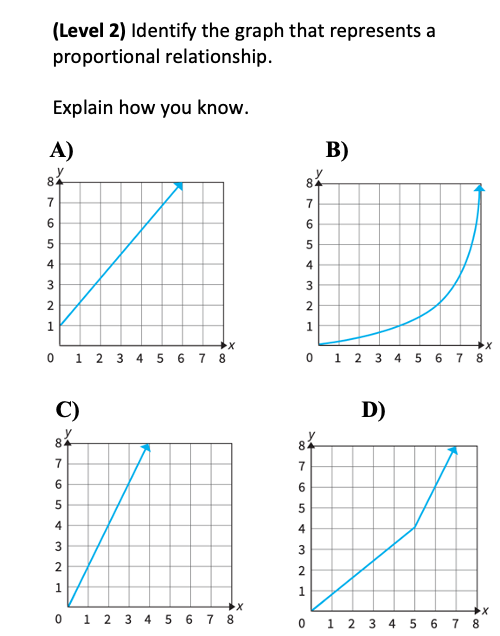
Identify the graph that represents a proportional relationship.
8.A.2.b
1
Explain how you know.
Explain how you know.
8.A.2.b
Identify the graph that represents a proportional relationship.
Explain how you know.
(Level 2) The line models the height of a glider, in feet, over x hours. Identify the y-intercept of the graph.
![]()
(Level 2) Identify all the relationships that represent a constant rate of change.
![]()
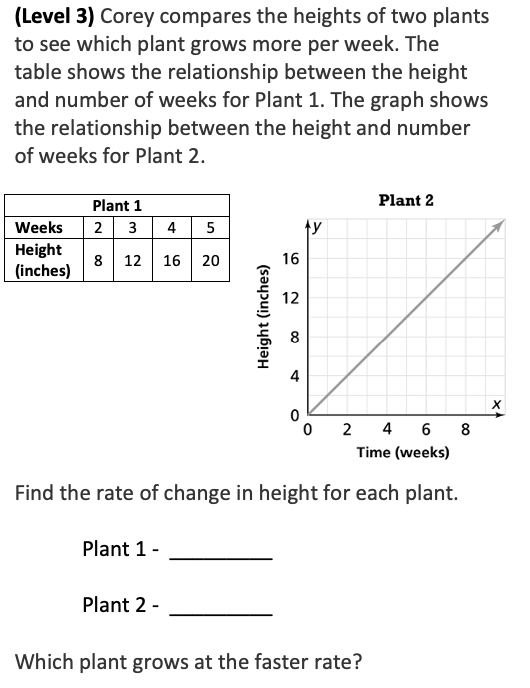
Find the rate of change in height of Plant 1.
Find the rate of change in height of Plant 2.
Which plant grows at the faster rate?
(Level 3) A public parking garage charges $3 per hour to park. Use the grid in the workspace to graph the line relating parking costs to time in hours.
(Level 3) Find the slope of the line for Train B and explain what it means.
![]()
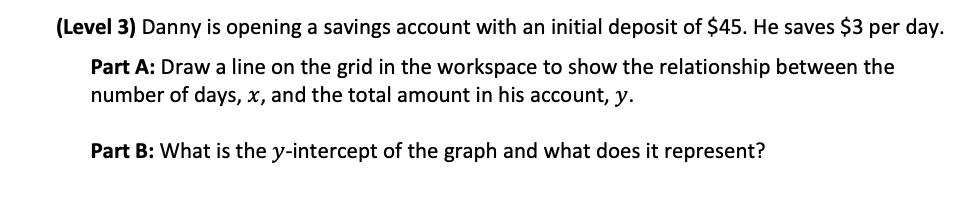
Draw a line in the workspace to show the relationship between the number of days,
What is the y-intercept of the graph and what does it represent?
(Level 3) The graph shows the volume of water in a sink
(Level 4) Graph the following equation on the coordinate plane in the workspace.
(Level 4) Use the graph below to write an equation and describe in words the cost of parking in the parking garage.
![]()