ACT Practice test Week 4
star
star
star
star
star
Posljednje ažuriranje almost 2 years ago
40
1
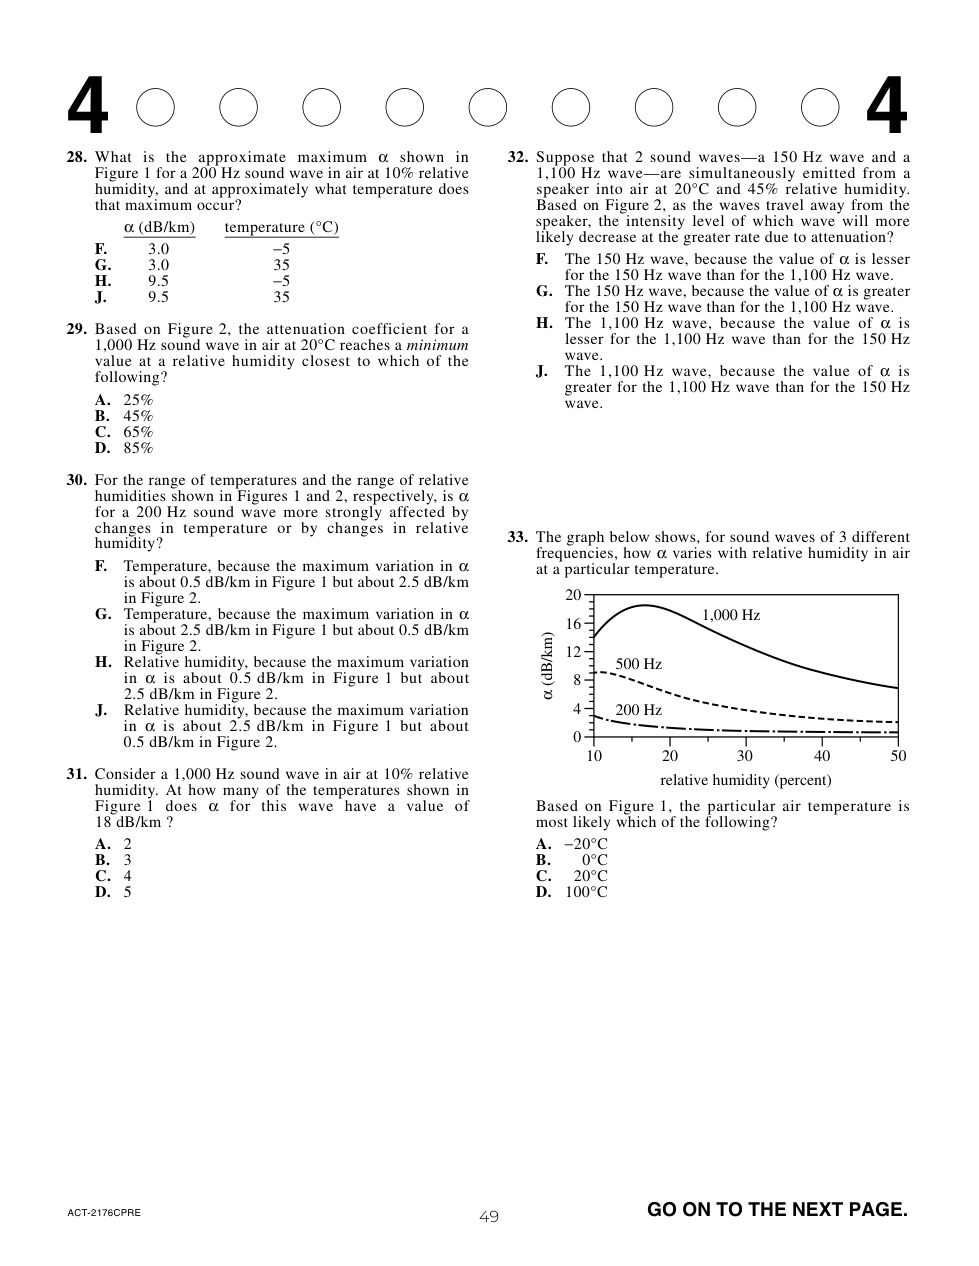
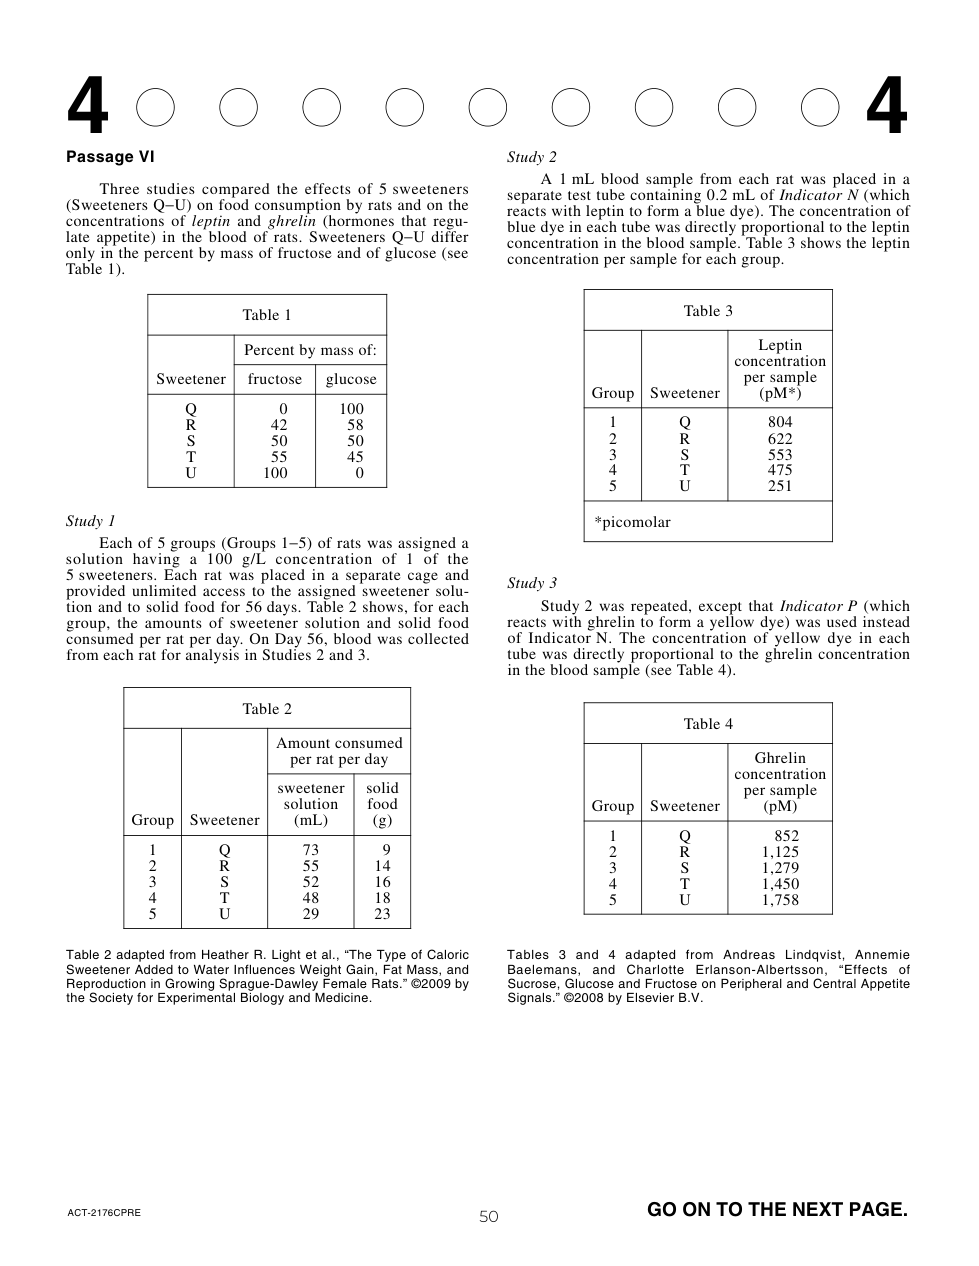
What is the approximate maximum α shown in Figure 1 for a 200 Hz sound wave in air at 10% relative humidity, and at approximately what temperature does that maximum occur?
α (dB/km) temperature (°C)
According to Scientist 2, friction between the rocks and the clay is reduced by which of the following?
Suppose a researcher observed that wind speeds
greater than 80 miles per hour are needed to move the
rocks in the playa. This observation is consistent with
which of the scientists’ explanations?
F. Scientists 1 and 2 only
G. Scientists 1 and 3 only
H. Scientists 2 and 3 only
J. Scientists 1, 2, and 3
Suppose that no seismic activity was recorded in the
playa where the trails left by the rocks are found. This
finding would weaken which of the scientists’
explanations?
A. Scientist 1 only
B. Scientist 3 only
C. Scientist 1 and Scientist 2 only
D. Scientist 2 and Scientist 3 only
Suppose it were discovered that a particular rock formed a 200 m long trail in 72 hr. Would this discovery support Scientist 1’s explanation?
Suppose that during one year there was no measurable movement of any rocks in the playa during the spring. Scientists 1 and 2 would most likely both agree that this was due to the absence of which of the following factors?
Suppose that air temperature in the playa varies between 4°C and 47°C. Would this information support the explanation of Scientist 2 ?
Based on Scientist 1’s explanation, a rock trail that is 33 cm wide was most likely made by a rock with approximately what width?
If another trial had been performed in Experiment 2 and 450 mL of liquid had been measured in the cylin-
der, the temperature of the diet cola in this trial would most likely have been:
9. Suppose Trial 6 had been repeated, but the bottle of diet cola had been opened and then left undisturbed at 25°C for 12 hours before it was attached to the apparatus.Would the mass of CO2 produced in this trial likely be greater than 0.969g or less than 0.969g ?
10. One millimole (mmol) of CO2 has a mass of 0.044 g. How many trials resulted in the production of at least 1 mmol of CO2 ?
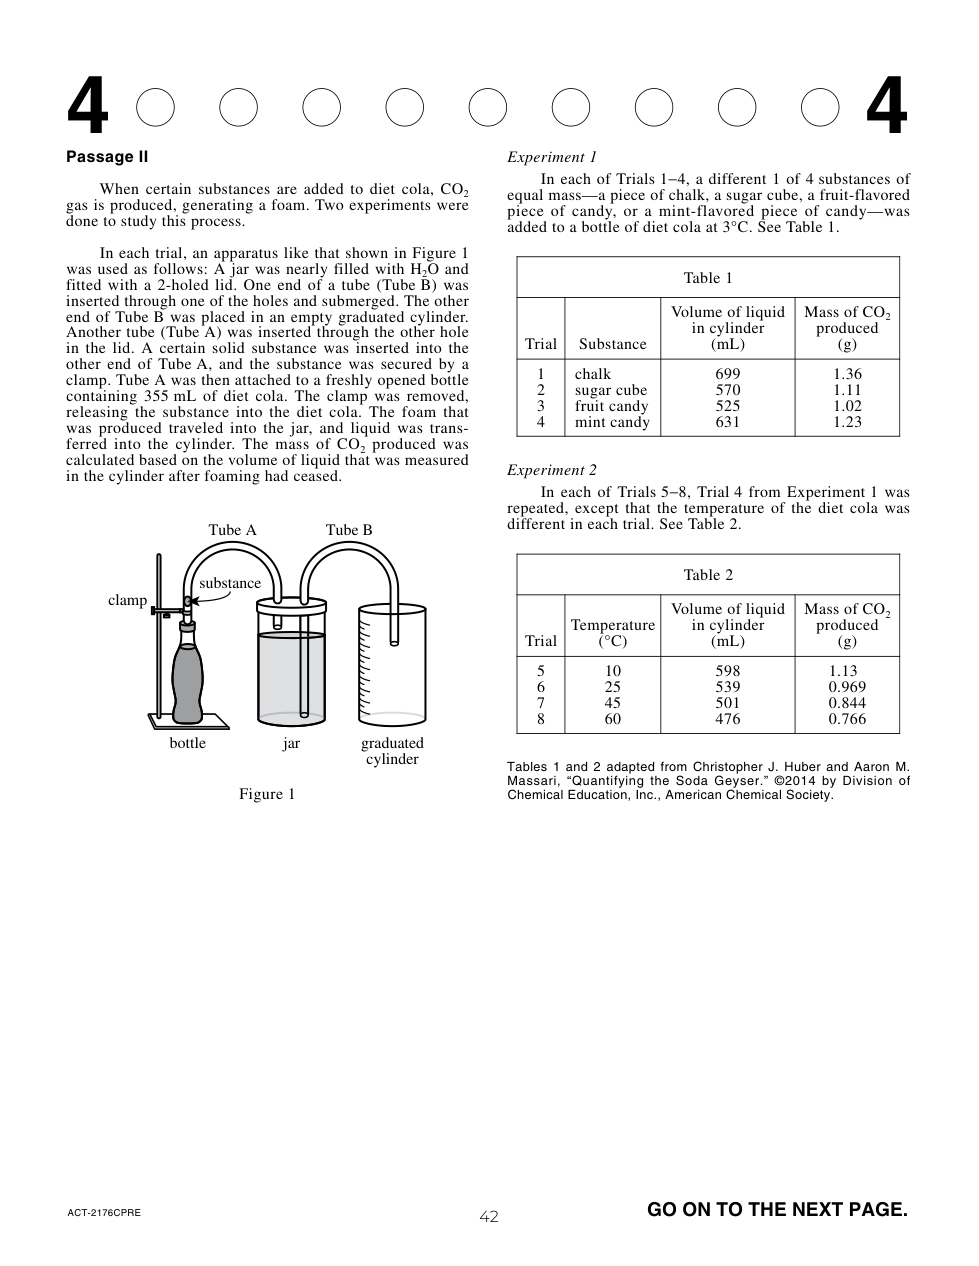
According to Figure 1, which of Tube A and Tube B, if either, had at least one end submerged in a liquid before the clamp was removed?
Is the relationship between the volume of liquid in the cylinder at the end of the experiment and the mass of CO2 produced a direct relationship or an inverse relationship?
Consider these steps that were performed in each trial.
1. Removing clamp
2. Measuring liquid in cylinder
3. Inserting a solid substance into Tube A
4. Attaching Tube A to a bottle of diet cola
According to the procedure, these steps were per- formed in what sequence?
Assume that room temperature is 25°C. In how many trials was the diet cola tested at a temperature lower than room temperature?
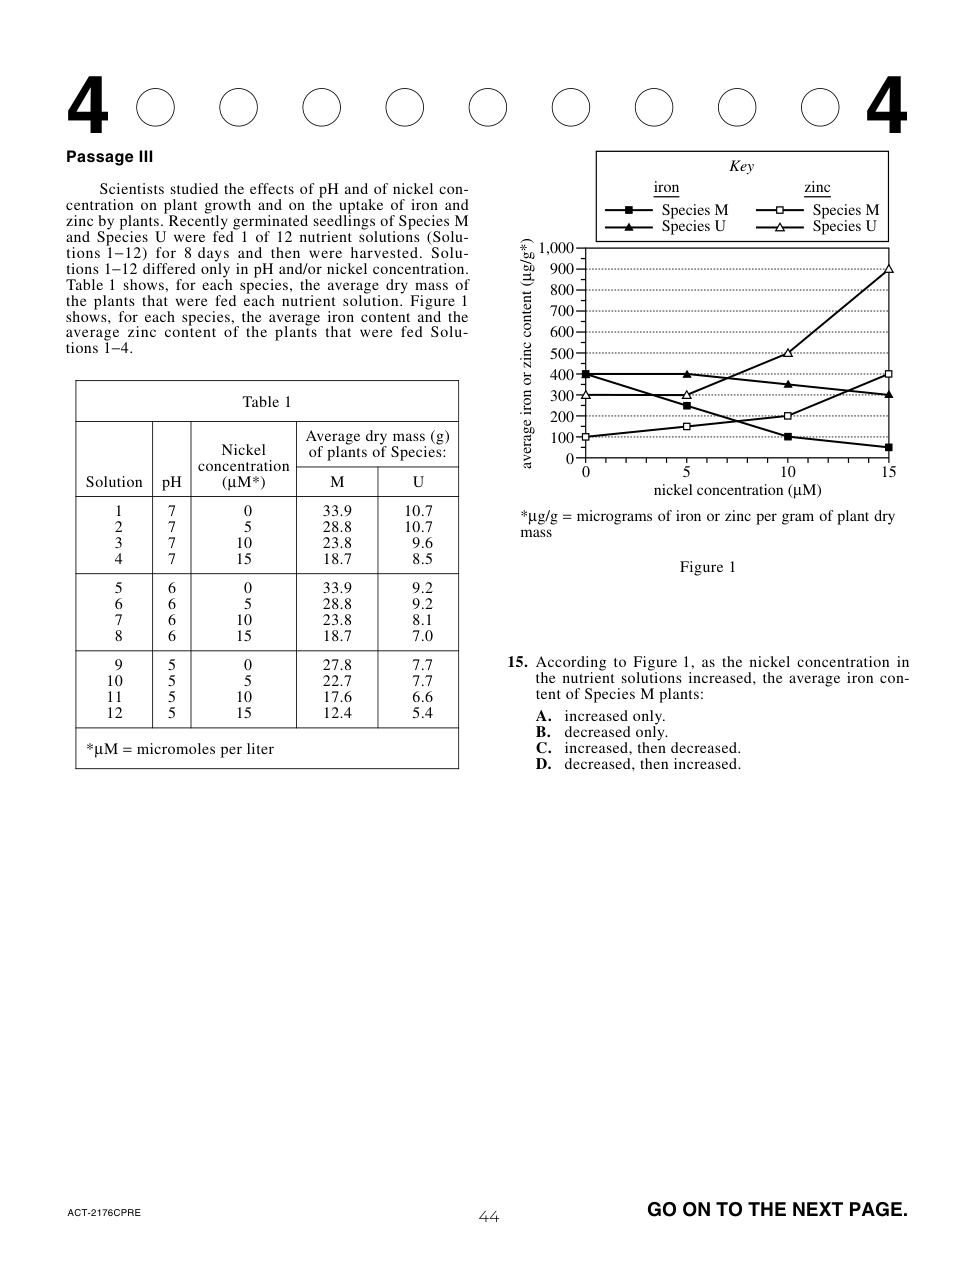
According to Figure 1, as the nickel concentration in the nutrient solutions increased, the average iron content of Species M plants:
According to Table 1, the Species U plants that were fed the solution that had a pH of 6 and a nickel concentration of 10 μM had an average dry mass of:
According to Table 1, Species M plants that were fed a nutrient solution with which of the following combinations of pH and nickel concentration had the greatest average dry mass?
pH nickel
According to Table 1 and Figure 1, the Species M plants that were fed Solution 3 had an average zinc content of:
According to Table 1 and Figure 1, for the Species M plants that were fed Solutions 1−4, what was the order of the nutrient solutions, from the solution that resulted in the lowest average iron content to the solution that resulted in the highest average iron content?
20. According to Table 1, compared to the average dry mass of Species U plants that were fed Solution 3, the average dry mass of Species M plants that were fed Solution 6 was approximately:
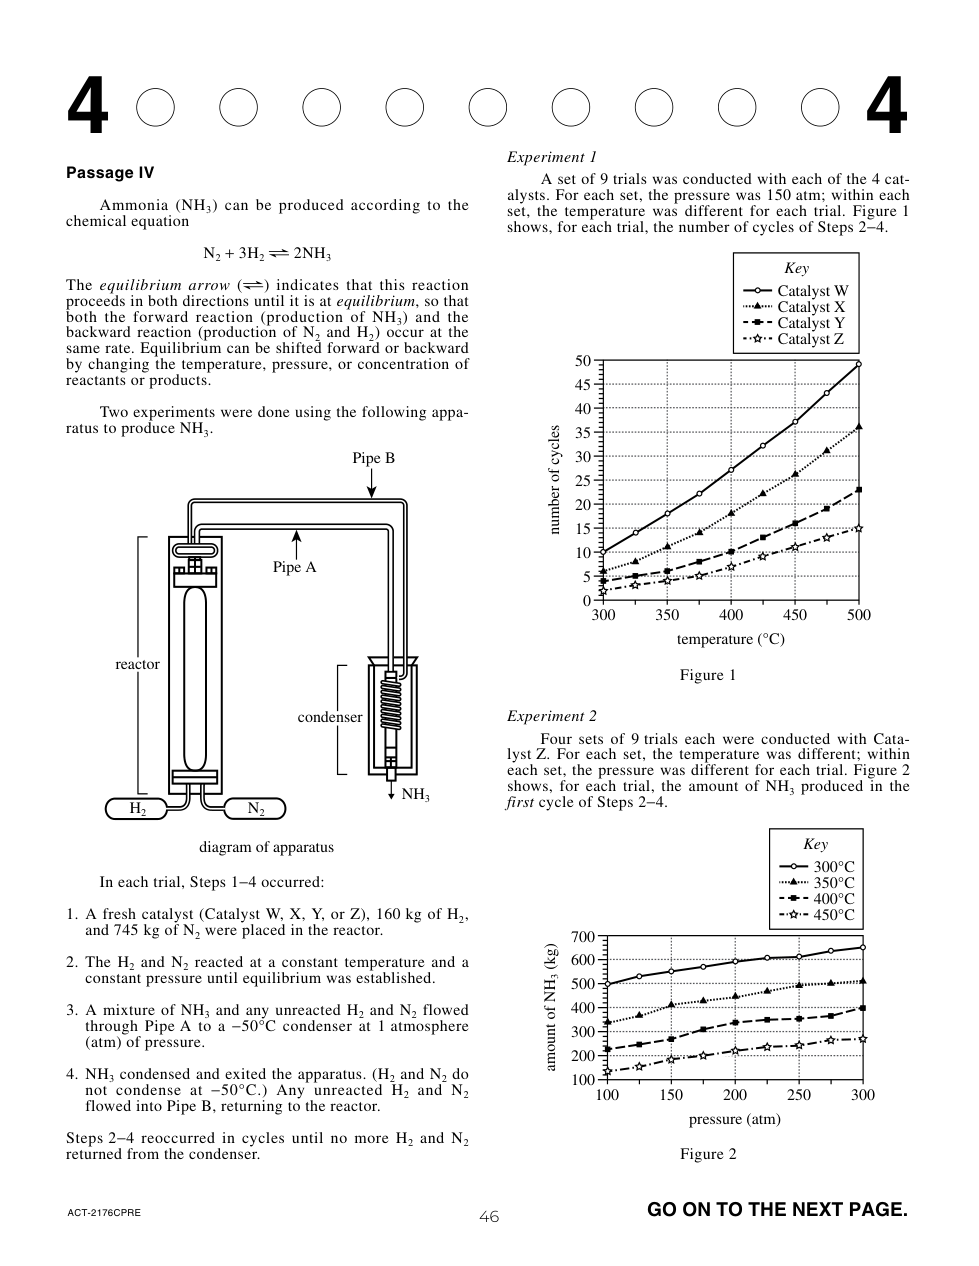
According to the results of Experiment 1, for any given
catalyst, as the temperature was increased, the number
of cycles needed to complete the reaction:
In Experiment 1, 26 cycles were needed to complete
the reaction at 450°C when which catalyst was used?
The movement of H2 and N2 through the apparatus as
Steps 1−4 occurred is best represented by which of the
following expressions?
Consider the results of Experiment 1 for 375°C. All
the H2 and N2 were consumed in less than 20 cycles
when which catalysts were used?
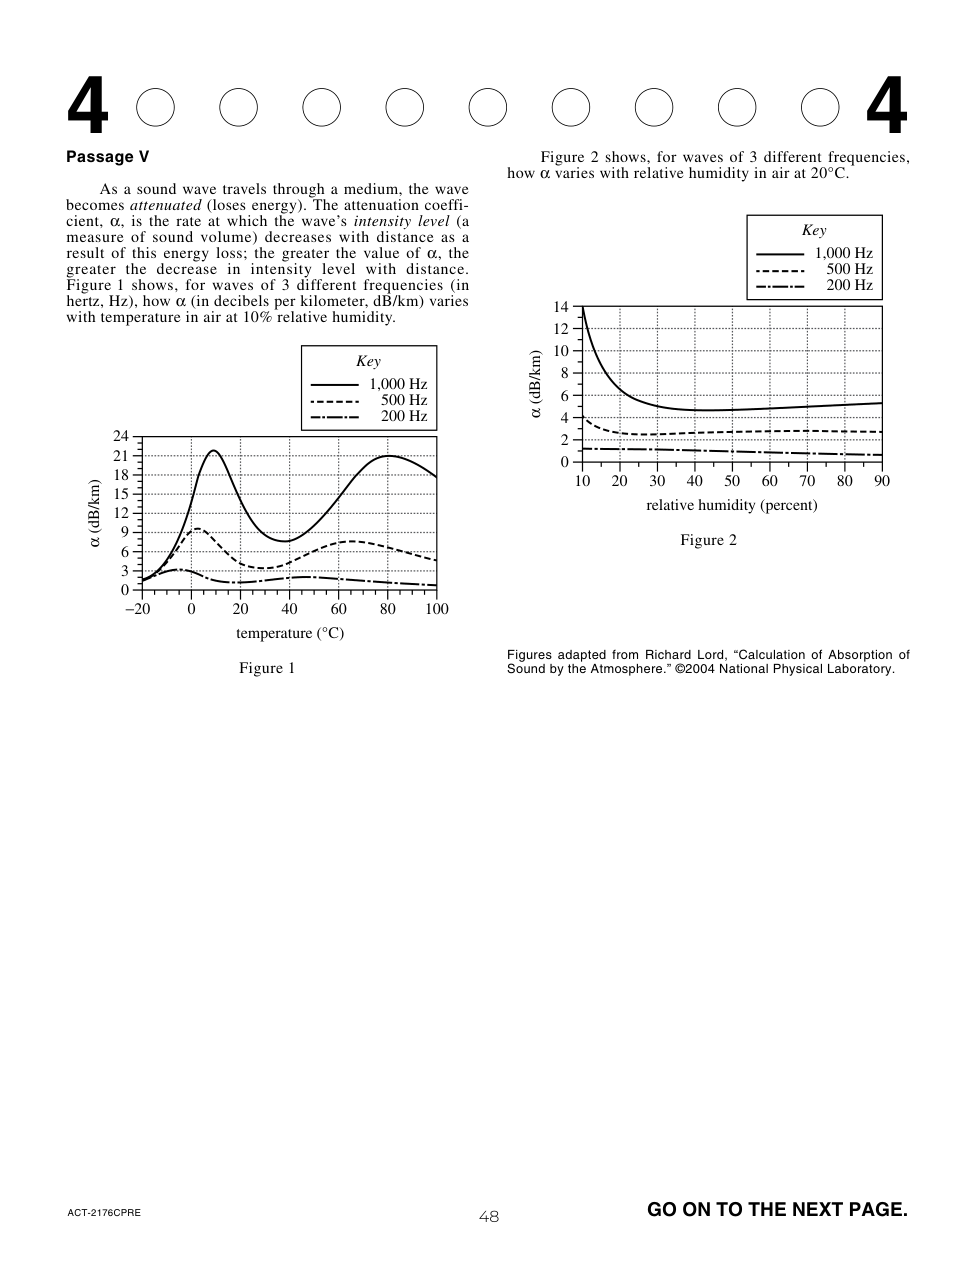
If a trial had been performed in Experiment 2 at 425°C and 225 atm, the amount of NH3 produced would most likely have been:
At 1 atm of pressure, the melting point of NH3 is −77°C and the boiling point of NH3 is −33°C. Based on this information and the description of the apparatus, when the NH3 exited the condenser, was it more likely a solid or a liquid?
Consider the trial in Experiment 2 that produce 550 kg of NH3. Based on Figure 1, the number of cycles that were needed to complete the reaction in this
trial was most likely:
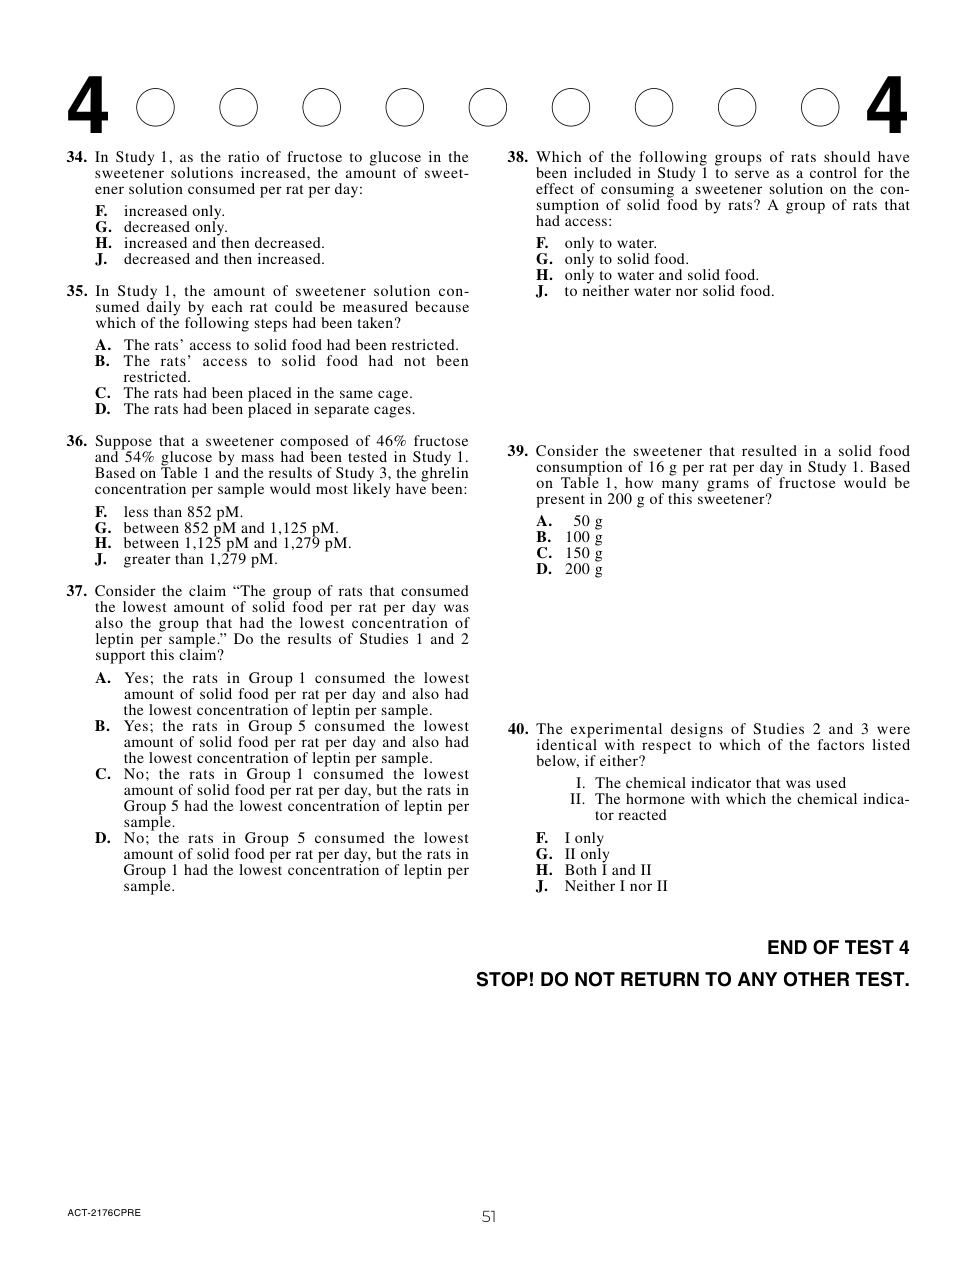
Based on Figure 2, the attenuation coefficient for a
1,000 Hz sound wave in air at 20°C reaches a minimum
value at a relative humidity closest to which of the
following?
For the range of temperatures and the range of relative
humilities shown in Figures 1 and 2, respectively, is α for a 200 Hz sound wave more strongly affected by changes in temperature or by changes in relative humidity?
Consider a 1,000 Hz sound wave in air at 10% relative humidity. At how many of the temperatures shown in Figure 1 does α for this wave have a value of 18 dB/km ?
Suppose that 2 sound waves—a 150 Hz wave and a 1,100 Hz wave—are simultaneously emitted from a speaker into air at 20°C and 45% relative humidity. Based on Figure 2, as the waves travel away from the
speaker, the intensity level of which wave will more likely decrease at the greater rate due to attenuation?