1
1
Create a graph. Plot the points.
Create a graph. Plot the points.
1
1
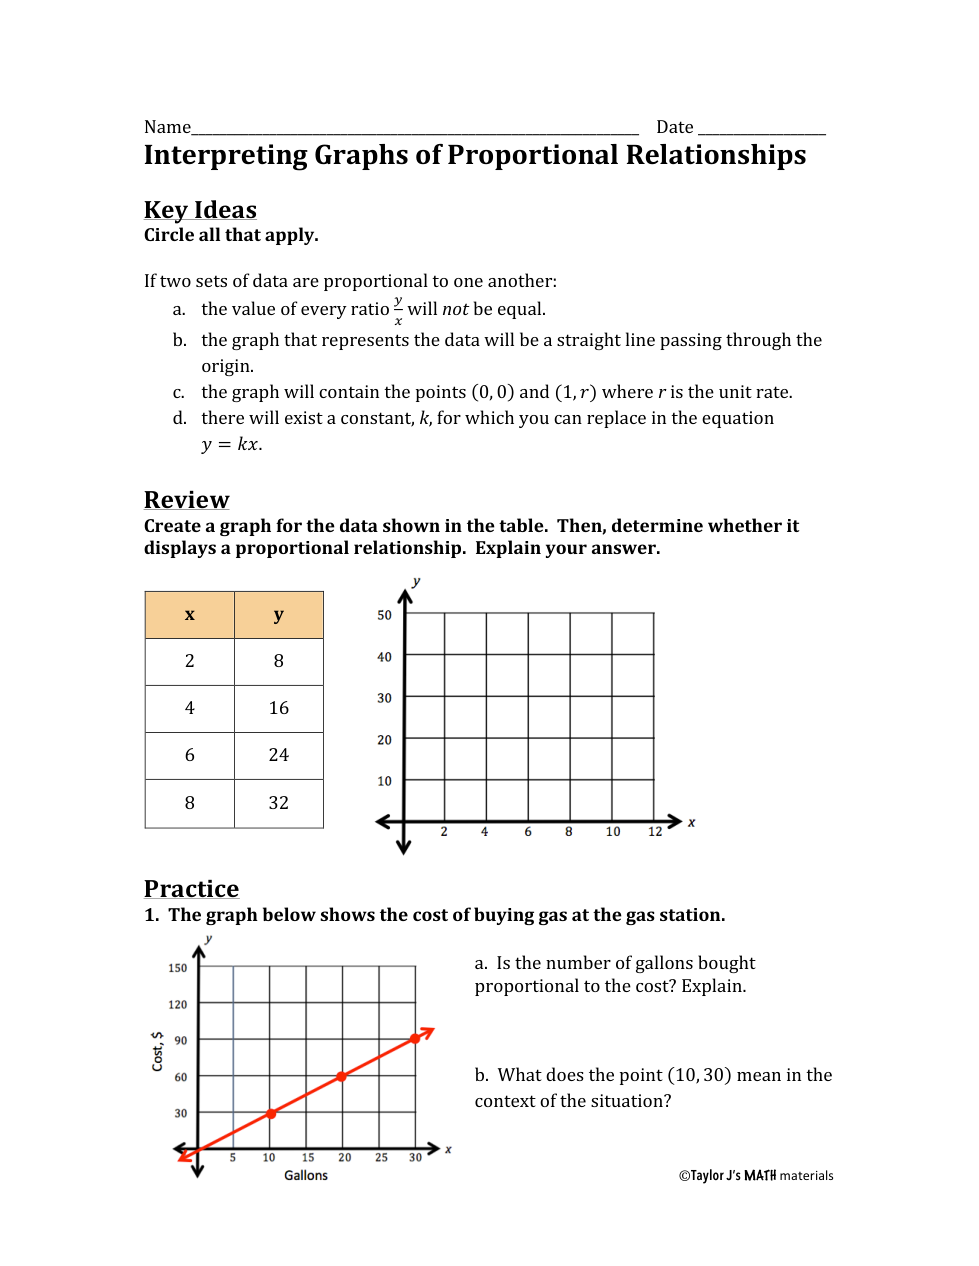
The number of gallons bought (is or is not)
1
1
Create a graph. Plot the points.
The number of gallons bought (is or is not)
Select all that apply
Does the graph represent a proportional relationship?
(10,30) means
Using the unit rate or constant, write an equation using y=kx.
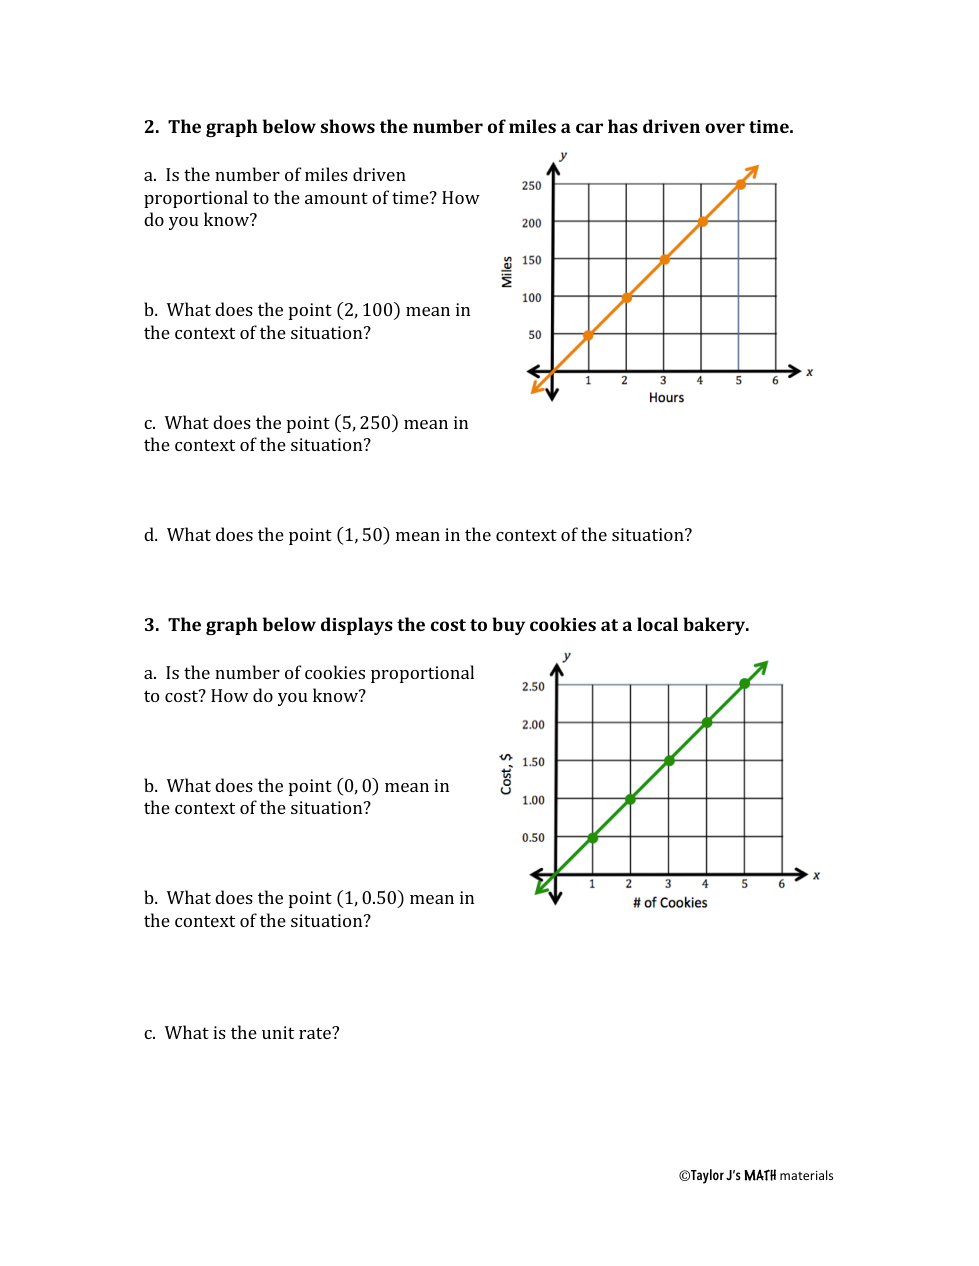
The number of miles driven (is or is not)
Using the unit rate or constant, write an equation using y=kx.
(2,100) means
100
(5,250) means
250
(1,50) means
The number of cookies (is or is not)
Using the unit rate or constant, write an equation using y=kx.
(0,0)
means
$0 for
(1, 0.50) means
$0.50 per
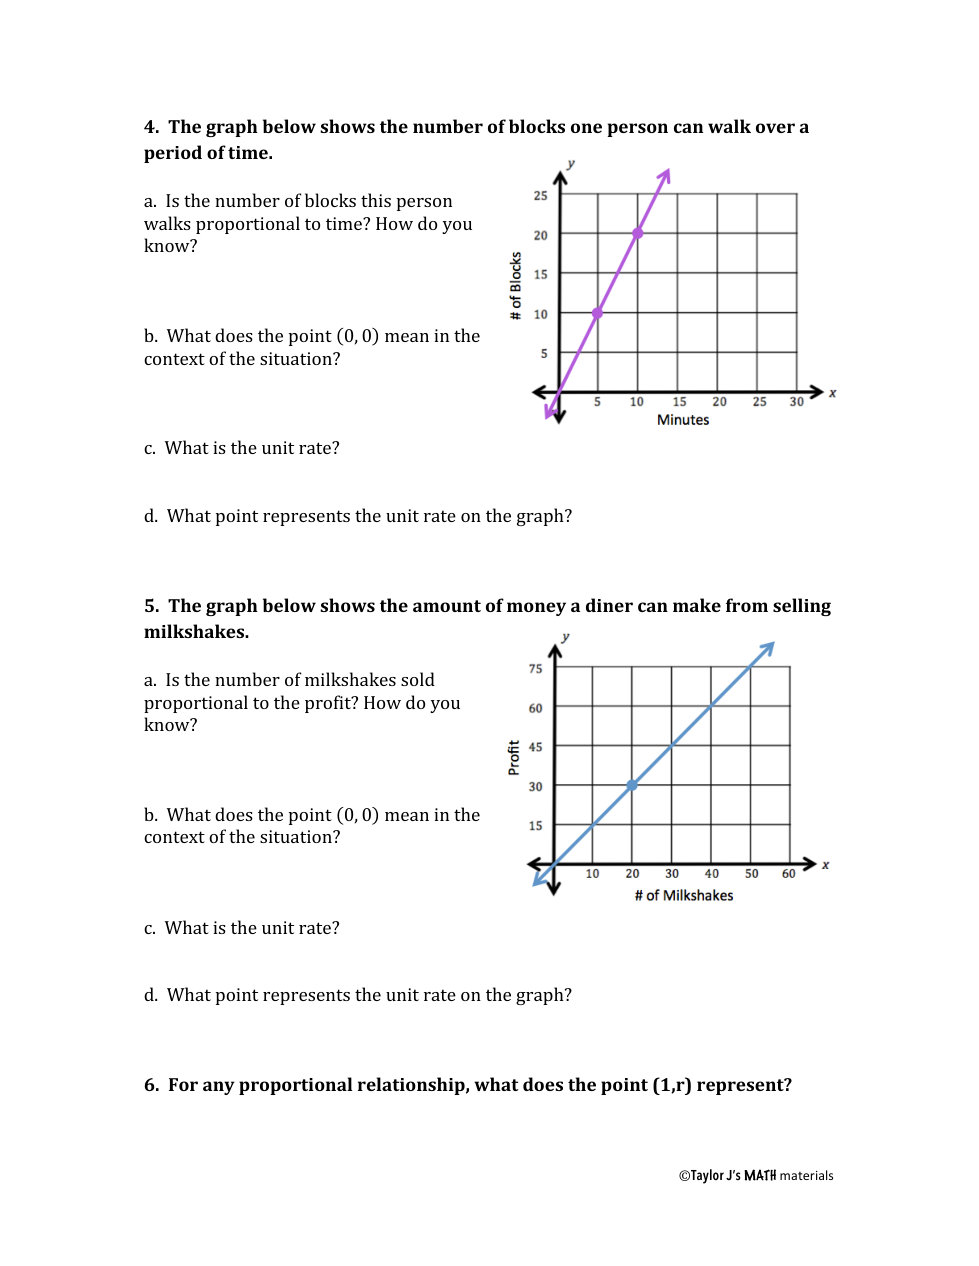
The number of blocks walked (is or is not)
Using the unit rate or constant, write an equation using y=kx.
(0,0) means
0
The point that represents the unit rate is
The number of milkshakes (is or is not)
Using the unit rate or constant, write an equation using y=kx.
(0,0) means
You will make a profit of
What does the unit rate (constant) mean?
The point that represents the unit rate is