7.2 Graphing Inequalities
star
star
star
star
star
Last updated 3 months ago
7 Nsɛmmisa
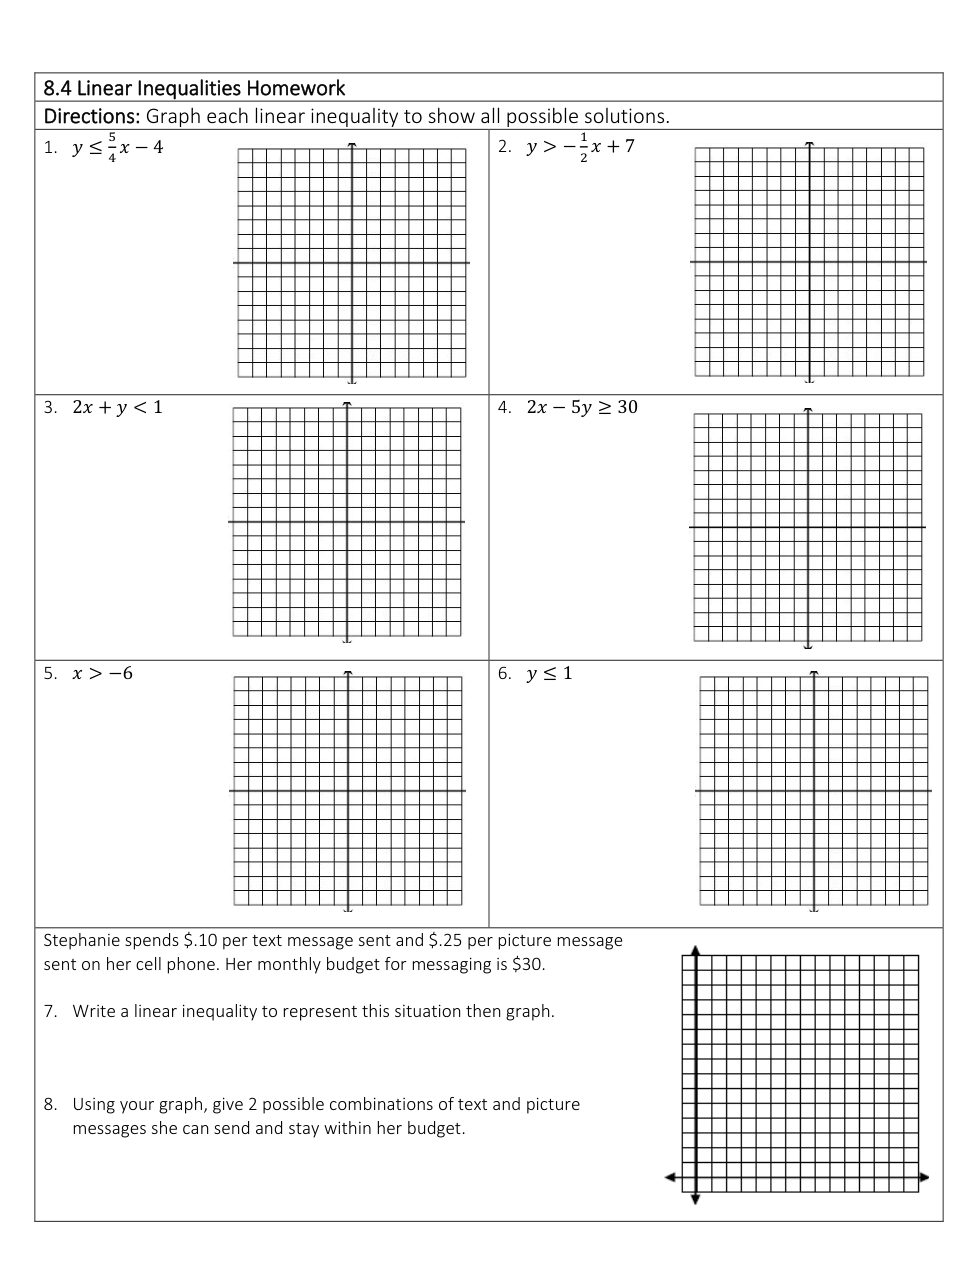
Graph the inequality (plot at least 2 points, and shade appropriate area)
Graph the inequality (plot at least 2 points, and shade appropriate area)
Graph the inequality (plot at least 2 points, and shade appropriate area)
Graph the inequality (plot at least 2 points, and shade appropriate area)
Graph the inequality (plot at least 2 points, and shade appropriate area)
Graph the inequality (plot at least 2 points, and shade appropriate area)
Write a linear inequality to represent this situation. Use t to represent text, and p to represent pictures.