1
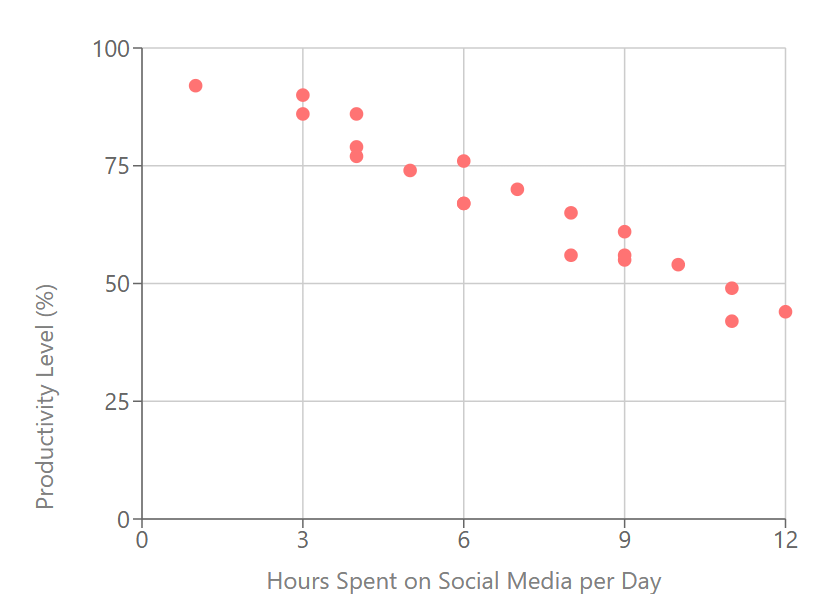
Examine the chart shown in the image, and type in your observations.
Examine the chart shown in the image, and type in your observations.
A researcher wants to investigate whether there is a relationship between the number of extracurricular activities a student participates in and their grade point average. The researcher has access to two databases with the following information:
Database 1:
First name
Last name
Grade point average (on a 0.0 to 4.0 scale)
Grade level (9, 10, 11, or 12)
Database 2:
First name
Last name
Number of extracurricular activities
Total hours spent on extracurricular activities
What step should the researcher take first to analyze the data?
A school administrator wants to investigate whether the number of hours students spend studying per week affects their performance in math. The administrator has access to the following databases:
Database 1:
Student ID
Full name
Grade level (9, 10, 11, or 12)
Math test scores
Database 2:
Student ID
Number of hours spent studying per week
What should the administrator use as the common key to combine the data from both databases?
Based of the question above, why is it better to use student ID to uniquely identify a student? Why can't we use full name?
A researcher wants to analyze the relationship between students’ sleep habits and their grade point averages. The researcher has collected the following information:
Average hours of sleep per night
Grade point average (GPA)
Grade level
What type of graph would best represent the relationship between average hours of sleep per night and GPA?
Examine the chart shown in the image, and type in your observations.
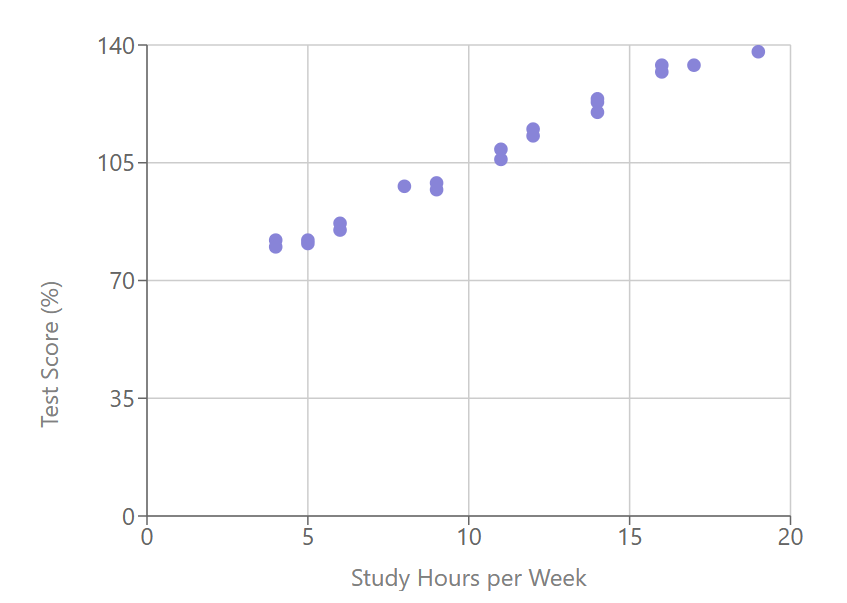
Examine the chart shown in the image, and type in your observations.
The relationship between speed of a car and time to reach a destination.
(is it positive or negative? Explain your answer choice)
A company collects customer feedback from two sources:
Source 1: Feedback stored as text (e.g., "Good," "Excellent").
Source 2: Feedback stored as numerical ratings (e.g., 4 out of 5).
Which of the following is the best approach to analyze the data?
A researcher is collecting data from two sources. One source stores students’ grades as percentages (e.g., 85, 92) and the other stores grades as letter grades (e.g., B, A).
What should the researcher do to combine the data effectively?
A company is training an AI system to recognize human faces. The training data consists primarily of images of adults from one geographic region. After deployment, users report that the system struggles to recognize faces of children and people from other regions.
What is the most likely cause of this issue?
A language translation app often provides inaccurate translations for dialects and less commonly spoken languages. The app performs well for widely spoken languages like English and Spanish.
What is the most likely reason for this disparity?
A political organization is conducting a survey to measure public support for a policy. The survey is distributed only to people who are known to support the organization’s views. The results show overwhelming support for the policy.
What is the issue with this approach to data collection?
A school distributes a survey about cafeteria food satisfaction, asking students to include their names. Many students who dislike the food provide positive responses.
What is the main issue with this survey?
Intentional bias occurs when the data collection process is deliberately skewed to favor a particular outcome
Metadata can sometimes provide more insights than the content itself. For example, metadata from online articles often includes (for example twitter posts):
Author's name
Publish date
Word count
Keywords
What type of analysis could be performed exclusively using this metadata?
A photographer uploads an image to a social media platform. The platform automatically uses the image's metadata to tag the location where it was taken. The metadata includes the GPS coordinates of the photo.
What is a potential risk associated with this use of metadata?
A school’s website was designed to handle 500 simultaneous users. On the first day of online class registration, 5,000 users attempt to access the site at the same time, causing it to crash.
Which of the following best describes the scalability issue?
Differentiate between data and information
age = [23, 21, 20, 22, 19, 18, 22, 25, 17, 24, 21]
What is the mean / average age?
age = [23, 21, 20, 22, 19, 18, 22, 25, 17, 24, 21]
If the above represent the ages of students at a bootcamp
Write a function that returns the average age of students above 18 years old (use any language of your choice, do not use inbuilt functions)