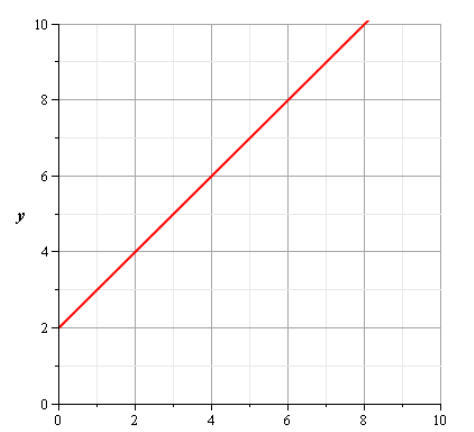
Find the slope for each graph shown below:

Slope:

Slope:

Slope:
Mmuae Afoforo a Wobɛpaw:
3
1
2
Find the slope for each graph shown below:
Slope:
Slope:
Slope:
Answer the following questions for the graph shown below:
Is the graph Proportional or Non-Proportional?
What is the slope of the graph?
What is the y-intercept?
Write the equation that represents the table below
What is the equation of the line in slope intercept form?
y=
What is the slope of the graph of
Gwen spent $12.50 to purchase 5 bracelets. Each bracelet cost the same amount. Which graph has a slope that best represents this rate?
The office printer can print 30 pages of documents per minute. Which one of the following graphs shows this relationship?
An Uber driver charges $0.45 per mile and an initial fee of $3. A Lift driver charges $0.35 per mile and an initial fee of $2. When will the cost of using Lift greater than taking Uber?
At a coffee shop, 24 customers were served over an 8-hour shift. Create a
linear graph that represents the number of customers that were served per hour at this
restaurant. Choose 2 points
Click on the y-intercept
This graph shows a proportional relational between the distance traveled by Tim on a road trip and the number of hours for which he traveled
Which statement identifies the correct slope and the correct interpretation of the slope for this situation?
Which graph shows a proportional relationship between xand y?


