Lesson 4.7 Beyond Simple Layers

Last updated 7 months ago
8 questions
Untitled Section 1
Be sure you watch this video first. He does an excellent job of explaining how you can use earthquakes to make an image of the interior of the earth. Trust me, if you don't watch the video, you will be sorry when you try to read the article.
1

When we say the waves are refracted when the density of the medium it is traveling though changes, we mean that the wave

1

Tomographic images of the earth are computed using the

1

What is the relationship between the speeds of compressional waves (P waves) and shear waves (S waves)?

1

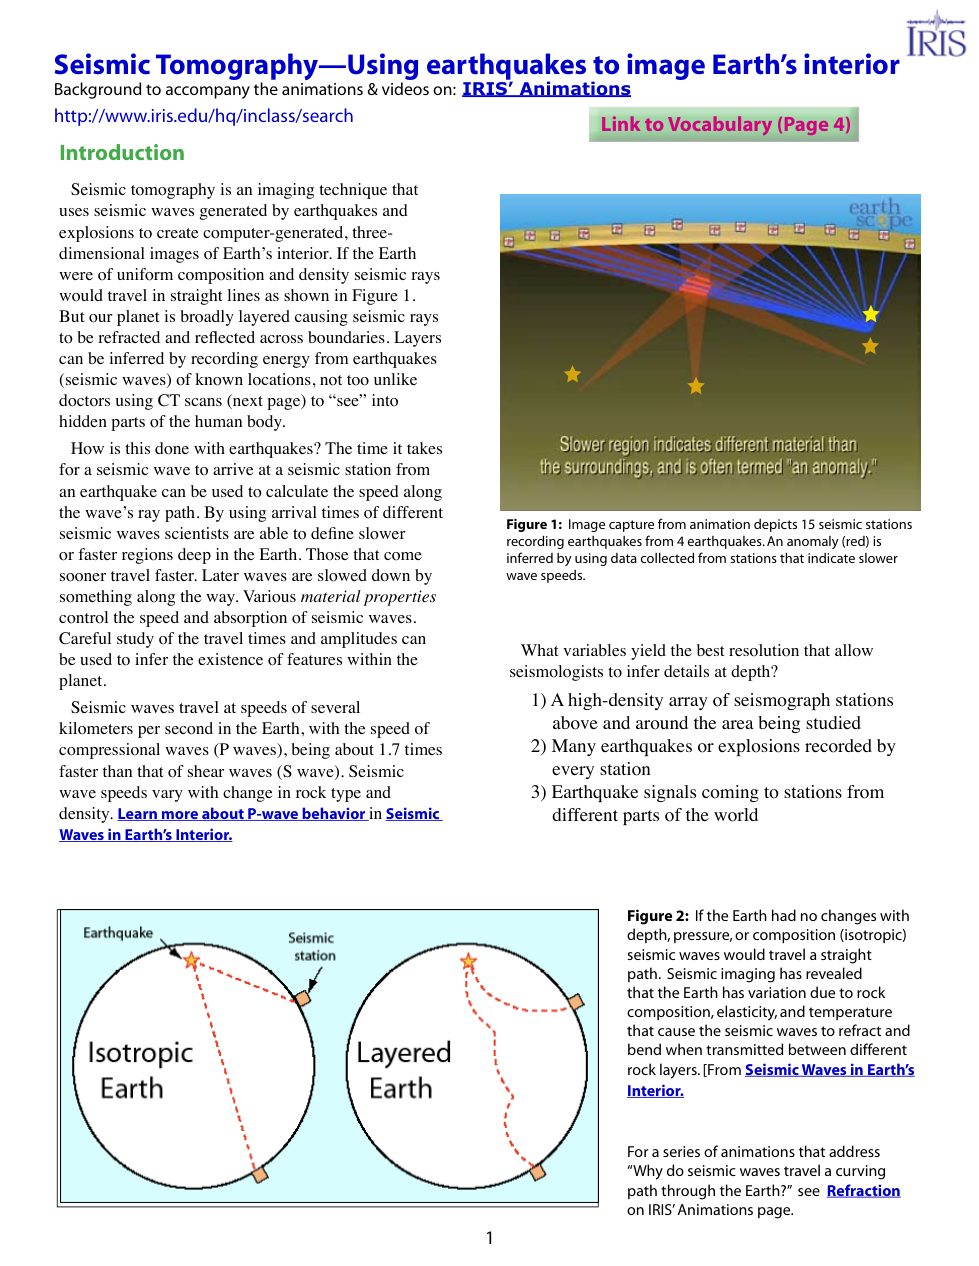
The resolution of an image is related to the detail and accuracy of the image. What factors help scientists create the highest quality images of the earth's interior in a particular area?

1

How do seismic waves behave if the Earth were isotropic? Isotropic means that something is of uniform composition and density.

The video below is an animation of how seismic waves actually travel on the surface. If the layers of the earth were isotropic (uniform) then the waves would travel as ever expanding ripples. The same pattern you would observe is you dropped a rock into a pond. The intense yellow areas in the pattern are areas where the seismic waves are stronger. Darker red are areas where the waves are weaker.
The next video shows what it would look like underneath the crust if the mantle was isotropic. The yellow red waves are the P-waves and the blue-green waves are the S-waves. This animation is similar to the figures in the Earthquake POGIL. Can you see the shadow created by the core?

The P is the data recorded by the seismometer at a single seismic station. The Pdiff is difference between two stations.
In the next video, they add an anomaly. It is very light grey and at the surface of the core at about 11 o'clock. Because the anomaly is a different density than the surrounding medium, the waves that pass by it are distorted. By comparing the data from thousands of pairs of stations, you can work out the size, shape and relative density of the anomaly.

The physics is the same as how an x-ray creates images of bone or cat-scans images of organs or even your phone camera creates a selfie.
The next video shows you an 3D image of the mantle produced by seismic tomography. It clearly shows that the mantle has structure. What's really interesting is that some of the structures extend from the bottom of the lower mantle up to the surface.
The models from seismic tomography clearly show that the mantle has structure. But what causes the regions of high and low density?

Scientists have debated the origin of the density since the technique was pioneered twenty years ago. Some have suggested that the high density regions might be concentrations of heavy metals. Others have suggested that low density regions might the remains of ancient continents pulled into the mantle by the movement of the tectonic plates. The theory that some of the regions might be the remains of a planet that collided with earth billions of years ago. However, substances also change density when they are heated. Heating substances decreases their density. So the regions of high and low density could all reflect difference in temperature.

There are two main theories:
1: The structures in the mantle reflected differences in chemical composition within the mantle.
2. The structures in the mantle reflected temperature differences in the mantle.
1

Why is studying the mantle challenging, and how have scientists traditionally analyzed its composition?

1

Which of the following are mentioned as implications of the research findings?

10

Discuss the significance of the research findings reported in 'Nature Geoscience' regarding the origin of lavas from volcanic hotspots. Which theory does the evidence summarized in the paper support?