1
1
1
1
1
1
1
1
1
1
1
1
1
1
1
1
1
I will know I am successful when:
*I can understand that proportional Graphs, Tables, & Equations together make a proportional relationship.
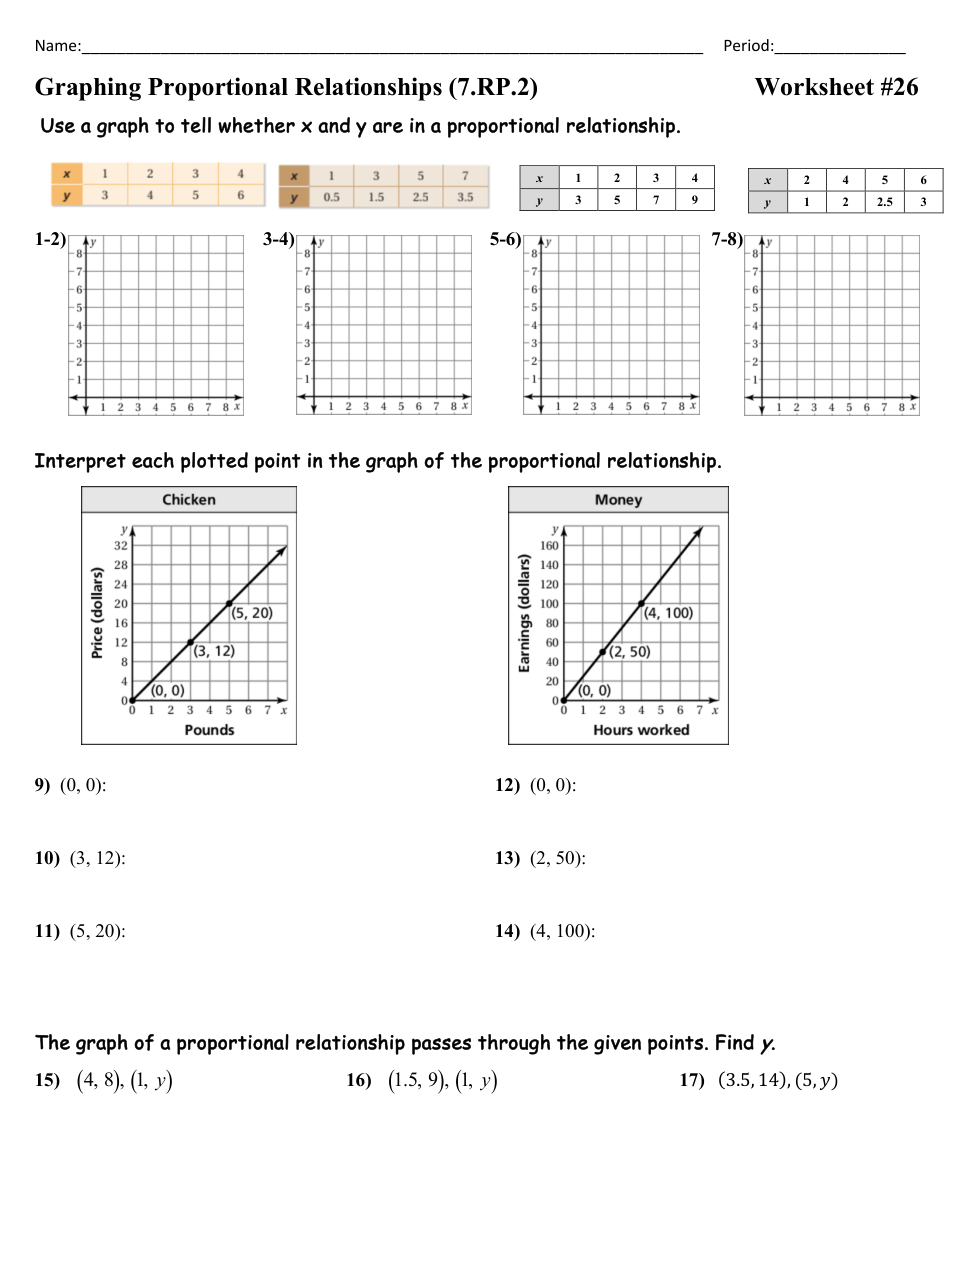
Graph the first point and last point in the table.
Choose if the graph is Proportional or Not Proportional and explain why.
Graph the points (2, 1) and (4, 2)
Choose if the graph is Proportional or Not Proportional and explain why.
Graph the first point and last point in the table.
Choose if the graph is Proportional or Not Proportional and explain why.
Graph the first point and last point in the table.
Choose if the graph is Proportional or Not Proportional and explain why.
Interpret point (0, 0) from the graph.
Interpret point (3, 12) from the graph.
Interpret point (5, 20) from the graph.
Interpret point (0, 0) from the graph.
Interpret point (2, 50) from the graph.
Interpret point (4, 100) from the graph.
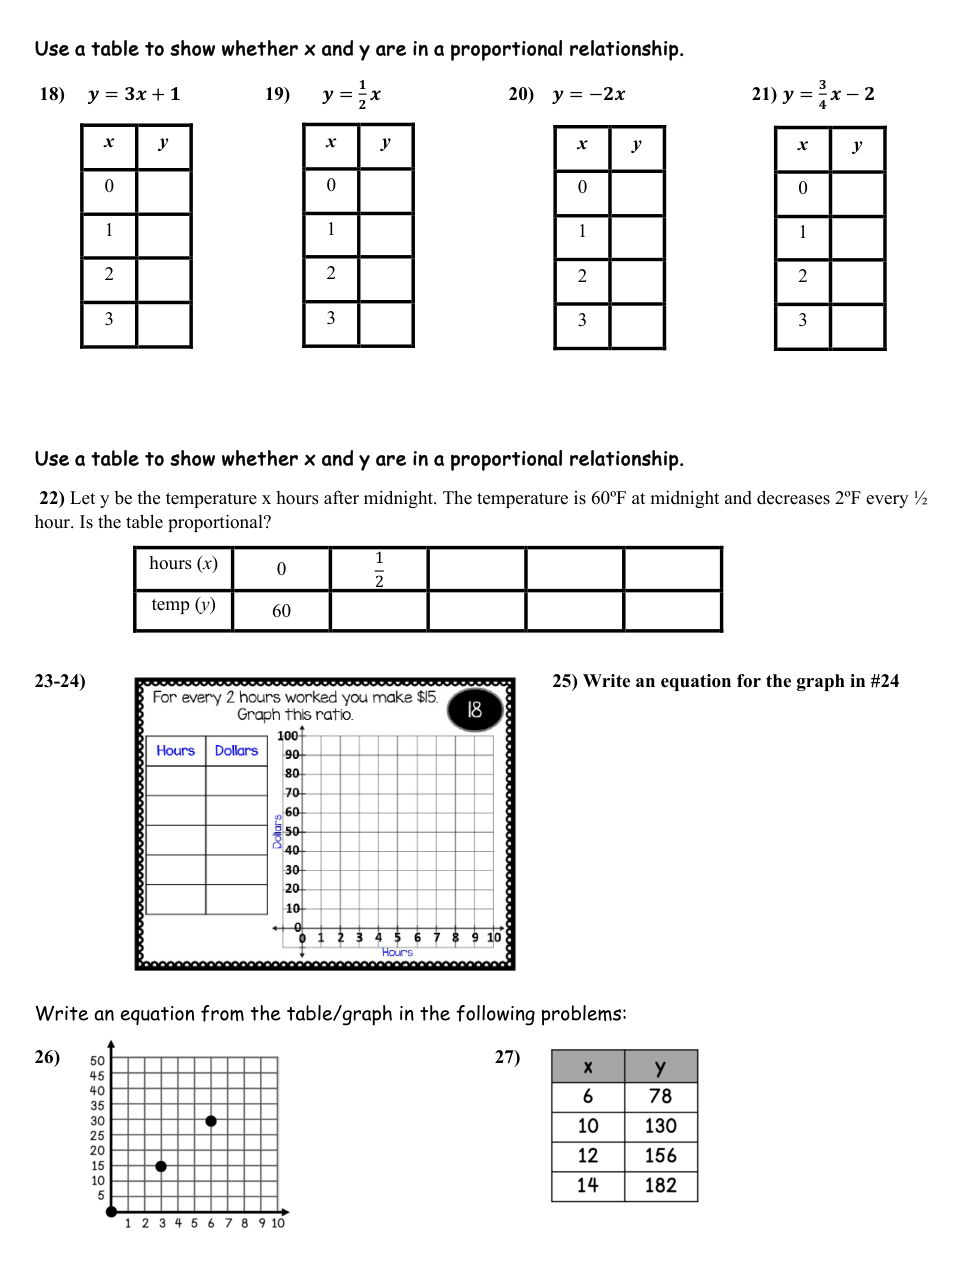
What is the value of y when x=1?
Write answer like: y=1
What is the value of y when x=1?
Write answer like: y=1
What is the value of y when x=5?
Write answer like: y=1
Choose if the table is Proportional or Not Proportional and explain why.
Choose if the table is Proportional or Not Proportional and explain why.
Choose if the table is Proportional or Not Proportional and explain why.
Choose if the table is Proportional or Not Proportional and explain why.
Complete the table.
| Stavka koja se može prevući | arrow_right_alt | Odgovarajuća stavka |
|---|---|---|
1 and 1/2 hours Past | arrow_right_alt | 60 degrees |
1 hour Past | arrow_right_alt | 58 degrees |
2 hours Past | arrow_right_alt | 56 degrees |
1/2 hour Past | arrow_right_alt | 54 degrees |
0 hours Past | arrow_right_alt | 52 degrees |
Complete the table.
| Stavka koja se može prevući | arrow_right_alt | Odgovarajuća stavka |
|---|---|---|
2 Hours | arrow_right_alt | $0 |
3 Hours | arrow_right_alt | $7.50 |
1 Hour | arrow_right_alt | $15 |
4 Hours | arrow_right_alt | $22.50 |
0 Hours | arrow_right_alt | $30 |
Graph the origin and point (2, 15).
Write an equation from your table/graph like: y=kx
Remember that k should look like:
Write an equation from the graph
like: y=kx
Remember that k should look like:
Write an equation from the table
like: y=kx
Remember that k should look like: