Your friend Abbie is making a movie. She is filming a fancy dinner scene and she has two types of candles on the table. She wants to determine how long the candles will last.
She takes a picture, lights the candles, and then lets them burn for 1 hour. She then takes a second picture. You can assume that each candle burns at the its own constant rate.
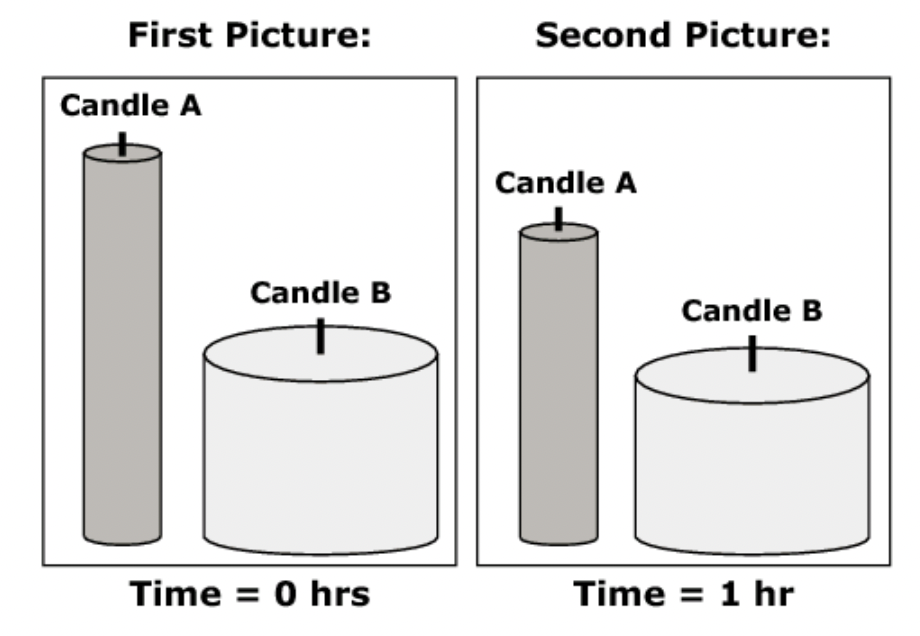
Candle Type A Initial height = 20 cm
Candle Type B Initial height = 10 cm
Candle Type A height after burning for 1 hour = 16 cm
Candle Type B height after burning for 1 hour = 9 cm
You will use this information to help Abbie think about the candles she might use for her film.
Candles A and B are lit at the same time. What will be the height, in cm, of each candle after 3 hours of burning?
Candle Type A:
Candle Type B:
Now, choose either Candle A or Candle B to create an equation that will tell Abbie the height of the candle at t hours after it is lit.
Determine what the numerical values for k and n should be for the candle you chose.
Using these k and n values, write an equation that tells Abbie the height h of the candle, in cm, at t hours after it is lit.
For her next film, Abbie wants candles that will burn for exactly 8 hours. You want to give her a choice by designing two different candles (Type C and Type D).
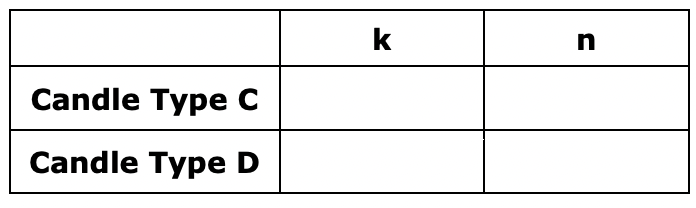
Using the equation h = k + nt, determine two different pairs of values for k and n that will meet the requirement to burn down to a height of 0 cm in exactly 8 hours.
Fill in the blanks to complete the table to show two possible sets of values for k and n for your new candle designs.

Candle Type C (k)
Candle Type C (n)
Candle Type D (k)
Candle Type D (n)
Candles of each type were lit at the same time. Abbie thinks that since Candle Type A burns more quickly than Candle Type B, that it will burn out (have a height of 0 cm) first.
Julie thinks that since Candle Type B starts out much shorter than Candle Type A, it will be the candle to burn out first.
Which candle will burn out first? Give a mathematical explanation to convince Abbie and Julie of your solution. Clearly identify the quantities involved.
Abbie has 3 hours left to film. She lights a new Candle Type A and Candle Type B and then starts filming.
In the 3 hours she has left, will Abbie capture the moment when the candles are exactly the same height?
Explain to Abbie how you can determine the answer.
You have decided to use functions to help Abbie think about the candles.
You show her how to represent the height of a candle, h, as a function of time, t, using this equation:
h = k + nt
First, explain to Abbie what k and n represent in order to model the different candles. Be specific in your explanation.
The school cafeteria is revising the menu to provide healthier foods. The cafeteria has chosen pizza as a food option because pizza can have many different toppings and is a good source of carbohydrates.
The staff asked your nutrition class for input in choosing a pizza. There are several factors to consider; however, you will just be considering nutrition. The serving size and nutritional information per serving for six pizza choices are shown in Table 1.
Table 1. Serving Size and Nutritional Information per Serving
Pizza | Serving Size (g) | Carbohydrates (g) | Sodium (mg) |
|---|---|---|---|
A | 93 | 23 | 400 |
B | 141 | 31 | 870 |
C | 159 | 54 | 710 |
D | 227 | 56 | 1080 |
E | 288 | 58 | 1460 |
F | 347 | 85 | 1900 |
You will determine the best pizza for the school cafeteria to serve. When deciding which pizza to recommend, you will look for a pizza that is high in carbohydrates (carbs) and protein and low in fat and sodium.
The school is considering two different pizza vendors. Each vendor’s price for cheese pizza is shown.
Mama’s Italian Pizza Corporation charges $17.50 per kilogram and can make any size pizza with a serving size up to 300 grams.
Luigi’s Pizza Pie Makers produces pizzas with six different serving sizes that have the costs shown in Table 2.
Table 2. Luigi’s Pizza Pie Makers' Pizza Costs
Serving Size (g) | Cost per Serving ($) |
|---|---|
93 | 1.67 |
141 | 2.63 |
159 | 2.99 |
227 | 4.35 |
288 | 5.57 |
347 | 6.75 |
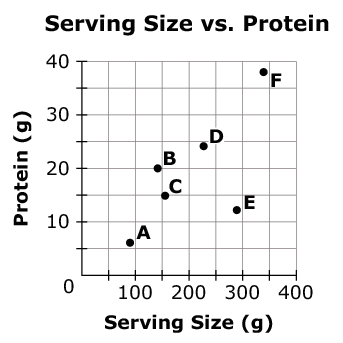
The cafeteria wants a pizza that has a high percentage of protein per serving. The scatter plot shows the amount of protein, in grams, compared to the serving size, in grams, for each of the six pizzas.

Write an equation for each company that shows the cost (
Enter the equation for Mama's Italian Pizza Corporation in the first response box.
Enter the equation for Luigi's Pizza Pie Makers in the second response box.
Using data from Table 1, determine whether Pizza A or Pizza E has a higher percentage of carbs per serving size. Include the percentage of carbs per serving size for both pizzas in your answer.
Interpret the scatter plot by:
describing the correlation between serving size and protein
identifying the pizza with the highest percentage of protein
explaining how you determined which pizza has the highest percentage of protein.
Your friend finds a different pizza that has a serving size of 230 grams with 12 grams of protein and 1152 milligrams of sodium. She thinks that this pizza should be considered for the cafeteria.
Choose her pizza or your pizza from question 3. Justify your choice by comparing the two pizzas using:
protein percentages
sodium percentages.
Your classmate claims that there is a negative correlation between sodium and serving size of the pizzas. He refers to Pizza B and Pizza C as an example.
You know that your classmate is incorrect. Explain the fault in his reasoning and describe the correct correlation between sodium and serving size. Use data to justify your reasoning.
Use the data in Table 1 and the information you found in Questions 10 and 11 to decide which pizza you think is the best choice to serve in the cafeteria. Write a recommendation to the cafeteria staff explaining which pizza you chose. The school wants pizza with a high percentage of carbohydrates and protein and a low percentage of sodium.
Explain why you think your choice is the best option for serving a pizza that is higher in carbohydrates and protein and lower in fat and sodium.
Support your choice with data from Table 1 or Question 10 or Question 11.