Exit Ticket: Histograms-Interpreting
star
star
star
star
star
Posljednje ažuriranje over 1 year ago
2 questions
Obavezno
1
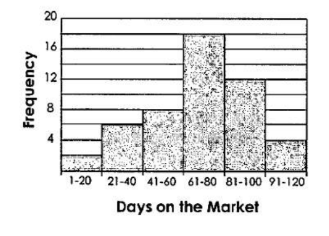
The histogram above gives the number of days that a group of homes were on the market last year before they sold. How many homes were on the market for at least 81 days?
The histogram above gives the number of days that a group of homes were on the market last year before they sold. How many homes were on the market for at least 81 days?
Obavezno
1
What percent of the homes were on the market for no more than 60 days?
What percent of the homes were on the market for no more than 60 days?