Exit Ticket: Box & Whisker Plots
star
star
star
star
star
Last updated over 1 year ago
3 Nsɛmmisa
Ɛhia
1
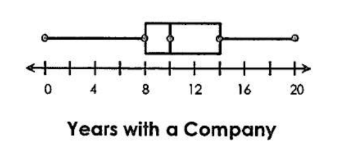
The box-and-whisker above shows the number of years that employees have worked at a certain company. Use the diagram to answer the following questions: What is the interquartile range?
The box-and-whisker above shows the number of years that employees have worked at a certain company. Use the diagram to answer the following questions: What is the interquartile range?
Ɛhia
1
Ɛhia
1