Twa kɔ nsɛm atitiriw so
Log in
Sign up for FREE
arrow_back
Laabri

Math Testlet 012 - Relationships between Dependent and Independent Variables 6.EEI.C.9b

star
star
star
star
star
Last updated 4 months ago
6 Nsɛmmisa
Ɛhia
1
6.EEI.C.9.b
Ɛhia
1
6.EEI.C.9.b
Ɛhia
1
Asemmisa {{asɛmmisaAhyɛnsode}}
1.

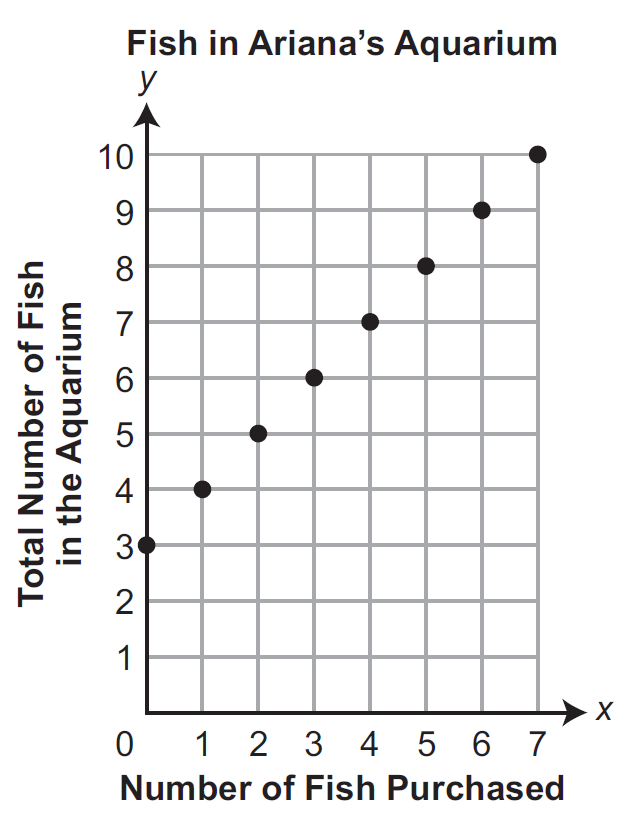
Ariana was given 3 fish for her birthday. Ariana decides to purchase more fish. The graph shows the total number of fish Ariana has in her aquarium after she purchases more fish. What is the dependent variable in this situation?

6.EEI.C.9.b
Ɛhia
1
Asemmisa {{asɛmmisaAhyɛnsode}}
2.

The table shows a relationship between x and y. What number completes the table?

6.EEI.C.9.b
Ɛhia
1
Asemmisa {{asɛmmisaAhyɛnsode}}
3.

Jasper is riding a bicycle at a constant speed. The graph shows the relationship between the number of hours Jasper spends biking and the distance he bikes.

What is the distance, in miles, Jasper bikes in 7 hours?

6.EEI.C.9.b

The equation y = 2x gives the relationship between an independent variable, x, and a dependent variable, y. A partial table of x-values and y-values is shown.

Asemmisa {{asɛmmisaAhyɛnsode}}
4.

Graph the ordered pairs for x = 1, x = 2, and x = 3 on the coordinate plane.

  • Klik Graph tab (Graph 1, Graph 2, ne nea ɛkeka ho) so ma graph biara a ɛsɛ sɛ wobɔ.
  • Klik graph no akyi na fa asɛm bi ka ho. Twe asɛm bi anaa kyerɛw x ne y coordinates na sesa ne gyinabea. Klik asɛm bi so na popa.

The graph of a relationship between an independent variable and a dependent variable is shown.

Ɛhia
1
Asemmisa {{asɛmmisaAhyɛnsode}}
5.

The graph is .

6.EEI.C.9.b
Asemmisa {{asɛmmisaAhyɛnsode}}
6.

Allison recorded information on the growth of a plant. She found that the plant grew at a rate of 4 centimeters (cm) per week. Use the words and numbers below the blank lines to complete the table showing Allison’s data. Make sure to type your answer choice exactly as listed under the line you wish to choose it for.

a=

b=

c=

d=