Categorize as function or not a fuction.
Categorize as function or not a fuction.


Function
Not a Function
Which ordered pairs represent the relation in the table?
Carson used the mapping shown to determine that a relations is a function.
Which set of ordered pairs represents the mapping?
Categorize as function or not a fuction.
Function
Not a Function
Determine whether the following represents a function or not.
Determine whether the following represents a function or not.
Which graph represents a function?
Which of the following is NOT a function?
Determine an appropriate table for the following function
Determine the appropriate graph for the following function
Leo and Kayla mow lawns to earn money. They use different functions to represent the amounts they charge, in dollars, for jobs that last
What is the initial value and rate of change for this function?
Determine whether the function below represents a linear or non-linear function. If linear, write a rule.
Determine whether the function below represents a linear or non-linear function. If linear, write a rule.
Determine whether the function below represents a linear or non-linear function. If linear, write a rule.
Determine whether the function below represents a linear or non-linear function. If linear, write a rule.
Which statement describes the situation modeled by the graph?
The price, P, of a Blizzard from Dairy Queen is $3 plus $0.25 per topping, t.
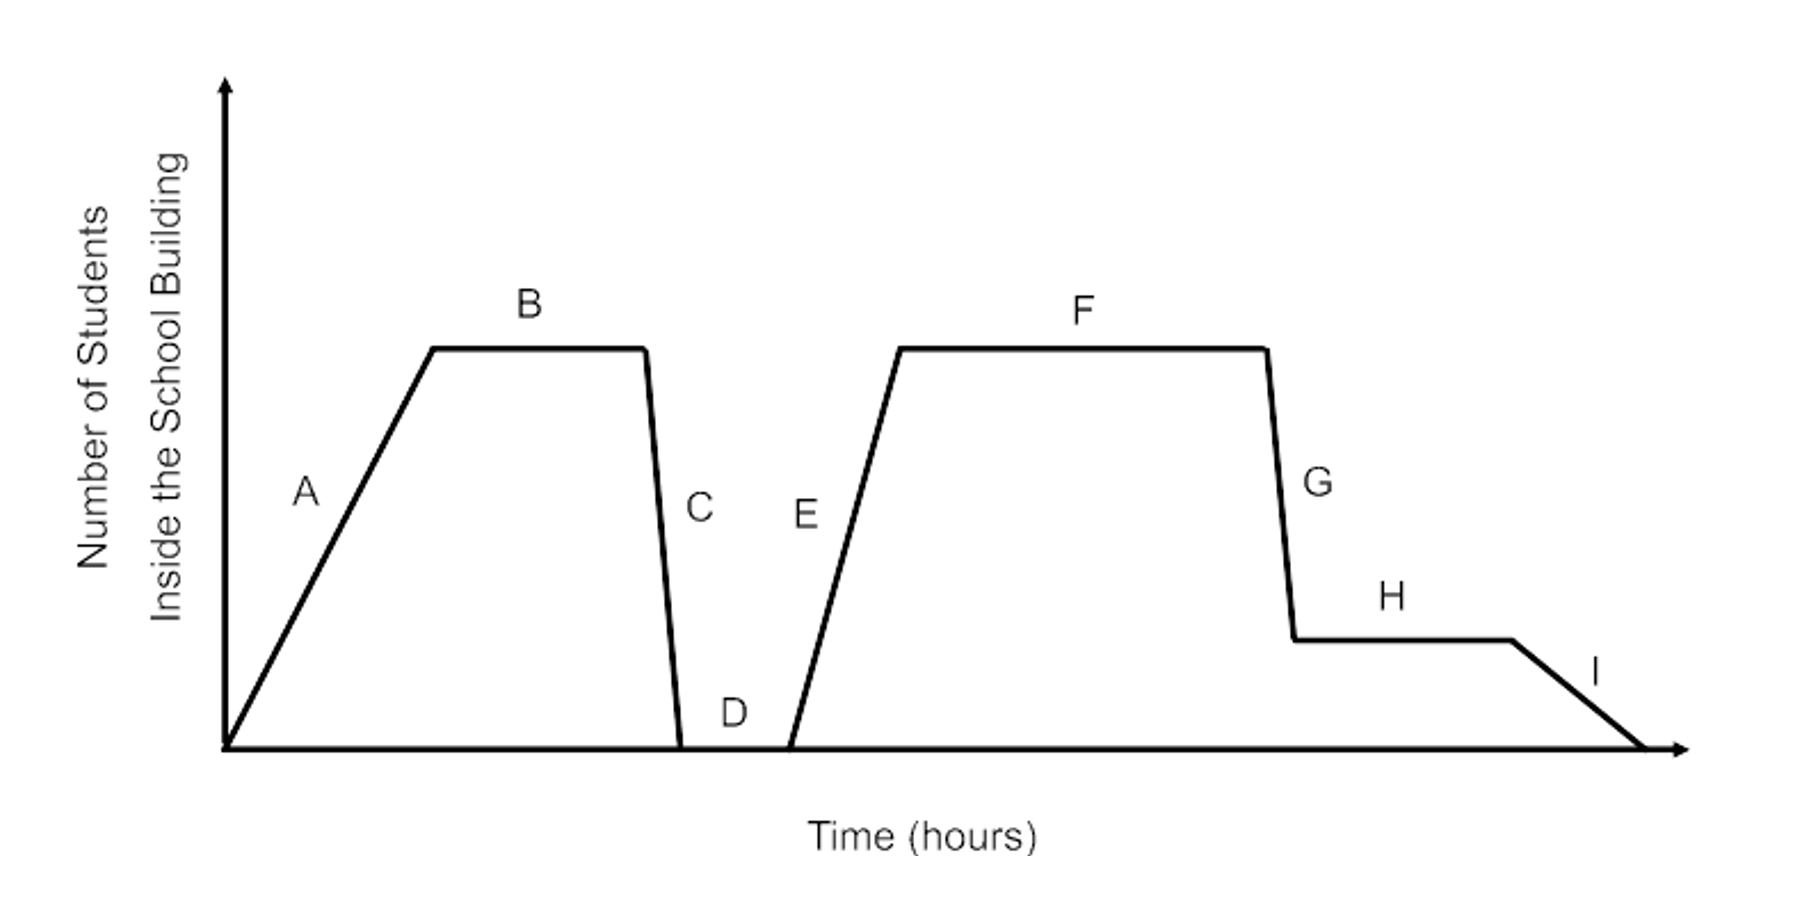
The graph shows time versus the number of students inside the school building during the hours of the day. On this particular day there is a fire drill. When are students exiting the school for the fire drill?
When are students in class during the
afternoon?
When are students still in the building for extracurricular (after-school) activities?