A grocery store manager records the outside high temperature in degrees Fahrenheit, x, and the number of ice cream bars sold, y, at the store for ten days. The equation shown represents the line of best fit for the store manager’s data.
Based on the line of best fit, which statement is true?

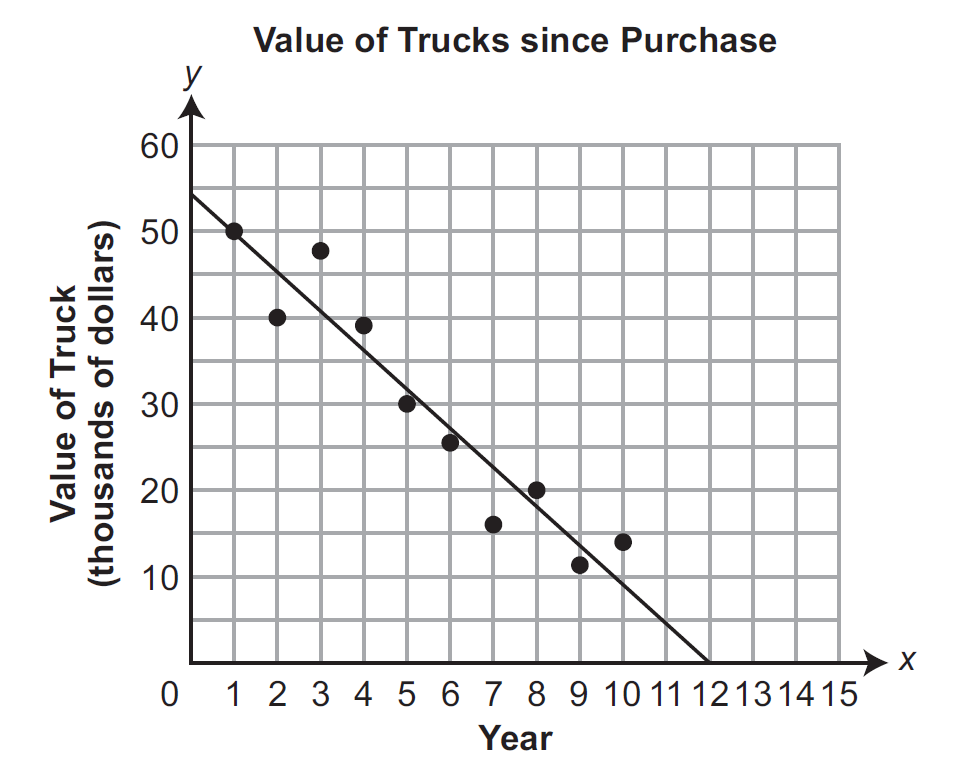
The scatter plot shows the relationship between the value of a truck, y, in thousands of dollars, and the number of years, x, since it was purchased. Each data point represents a
different truck.
The equation for the line of best fit for the data is

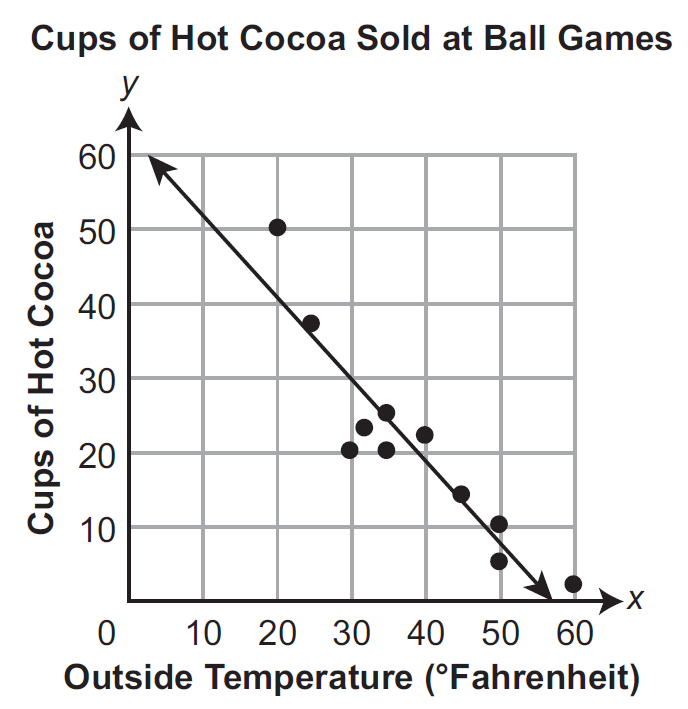
Students are selling cups of hot cocoa at ball games. They created the scatter plot shown to represent the number of cups of hot cocoa sold,
Based on the line of best fit, how many cups of hot cocoa can the students expect to sell when the outside temperature is 10 degrees Fahrenheit?
Douglas created a scatter plot of the average price for a gallon of milk in the United States each year since 1995. He calculated that the line of best fit is modeled by the equation
At a restaurant, the cost of a pizza with
Amran creates a scatter plot of the average price of a movie ticket each year since 2007. In the scatter plot,