This question is about species.
Ɛhia
1
What is a species?
What is a species?
Ɛhia
1
Ɛhia
3
What is a fossil?
What is variation?
What is the genome of an organism?
Where does the genome of an organism come from?
What characteristics can be inherited?
Can an organism genetically inherit characteristics their parents have learnt?
What part of an animal or plant cell contains genetic information?
Describe the structure of DNA
What chemical substances stores genetic information?
Is it possible to extract the DNA from an organism?
This question is about species.
What is a species?
This question is about variation within species.
Choose the correct option for each definition. Continuous variation – things that values. Discrete variation – things that values.
Sort the examples of variation into examples that are continuous or discrete.
Eye colour
Hair colour
Weight
Double jointed or not
Height
Length of arm
Examples of continuous variation.
Examples of discrete variation.
This question is about investigating variation in a species.
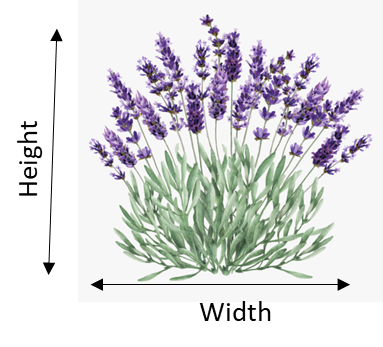
A biologist wanted to find out whether taller lavender plants were wider than shorter lavender plants. The plants are usually between 30-80cm in height and width.
This question is about variation through time.
Studying fossils of organisms from the past allows scientists to see how the characteristics of species slowly become more complicated over time.
Explain how the fossil record gives us evidence that species have changed over time.
Include: - How fossils are formed from dead organisms - How scientists can work out the age of a fossil - How the characteristics of more recent fossils compare to older ones
What can “infertile” offspring NOT do?
Explain why members of a species show variation.
What two measurement would they need to take?
What piece of equipment could they use to take this measurement?
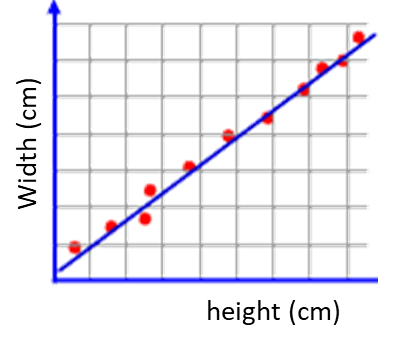
The biologist sampled data from 12 plants and produced this scatter graph:
What conclusion can the biologist make from their results?
What could they have to do to improve the evidence for their conclusion?
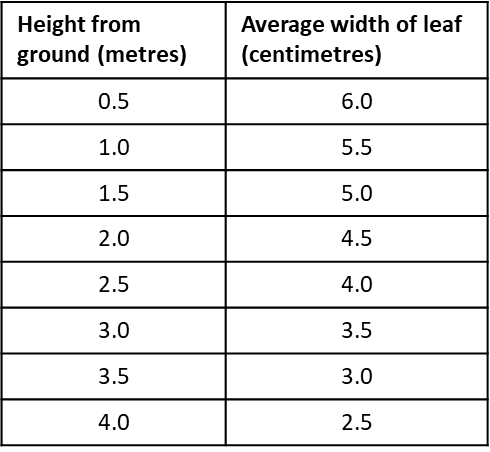
The Biologist carried out a different experiment and produced the following results:
Use the table to plot the remaining points on the graph.
Use the straight line tool to draw a line of best fit through your points.
Describe the correlation shown by the graph.