
Read the LO. What vocabulary must you be able to define to be successful in this TEK?
Read the LO. What vocabulary must you be able to define to be successful in this TEK?
Scatterplots
TODAYS LESSON IS BEST PRACTICED ON PAPER 1st. We will Practice on paper before we go into strategies on computer.
Read the LO. What vocabulary must you be able to define to be successful in this TEK?
You can graph data that measures two quantities in a scatterplot. A scatter plot helps us visualize if there is a relationship between bivariate data. Bivariate data is the comparison of two quantities of data. For example x and y coordinate or comparing study time and grades on an exam.
A pattern of data points is called a trend, an association or a correlation. Sometimes the data points may be approximated by a straight line, in which case a trend line can be drawn and used to make additional predictions.
There are two forms of scatterplots, those with linear relationships and those with non-linear relationships.

What is a scatterplot and what does it help us do?
What is bivariate data and what common relationship does it help us describe?
What is a trend?
CHECK FOR UNDERSTANDING
Linear Positive | Linear Negative | Non-Linear (Curved) | No Correlation | |
|---|---|---|---|---|
| ||||
| ||||
| ||||
| ||||
| ||||
| ||||
| ||||
|
NOTES:

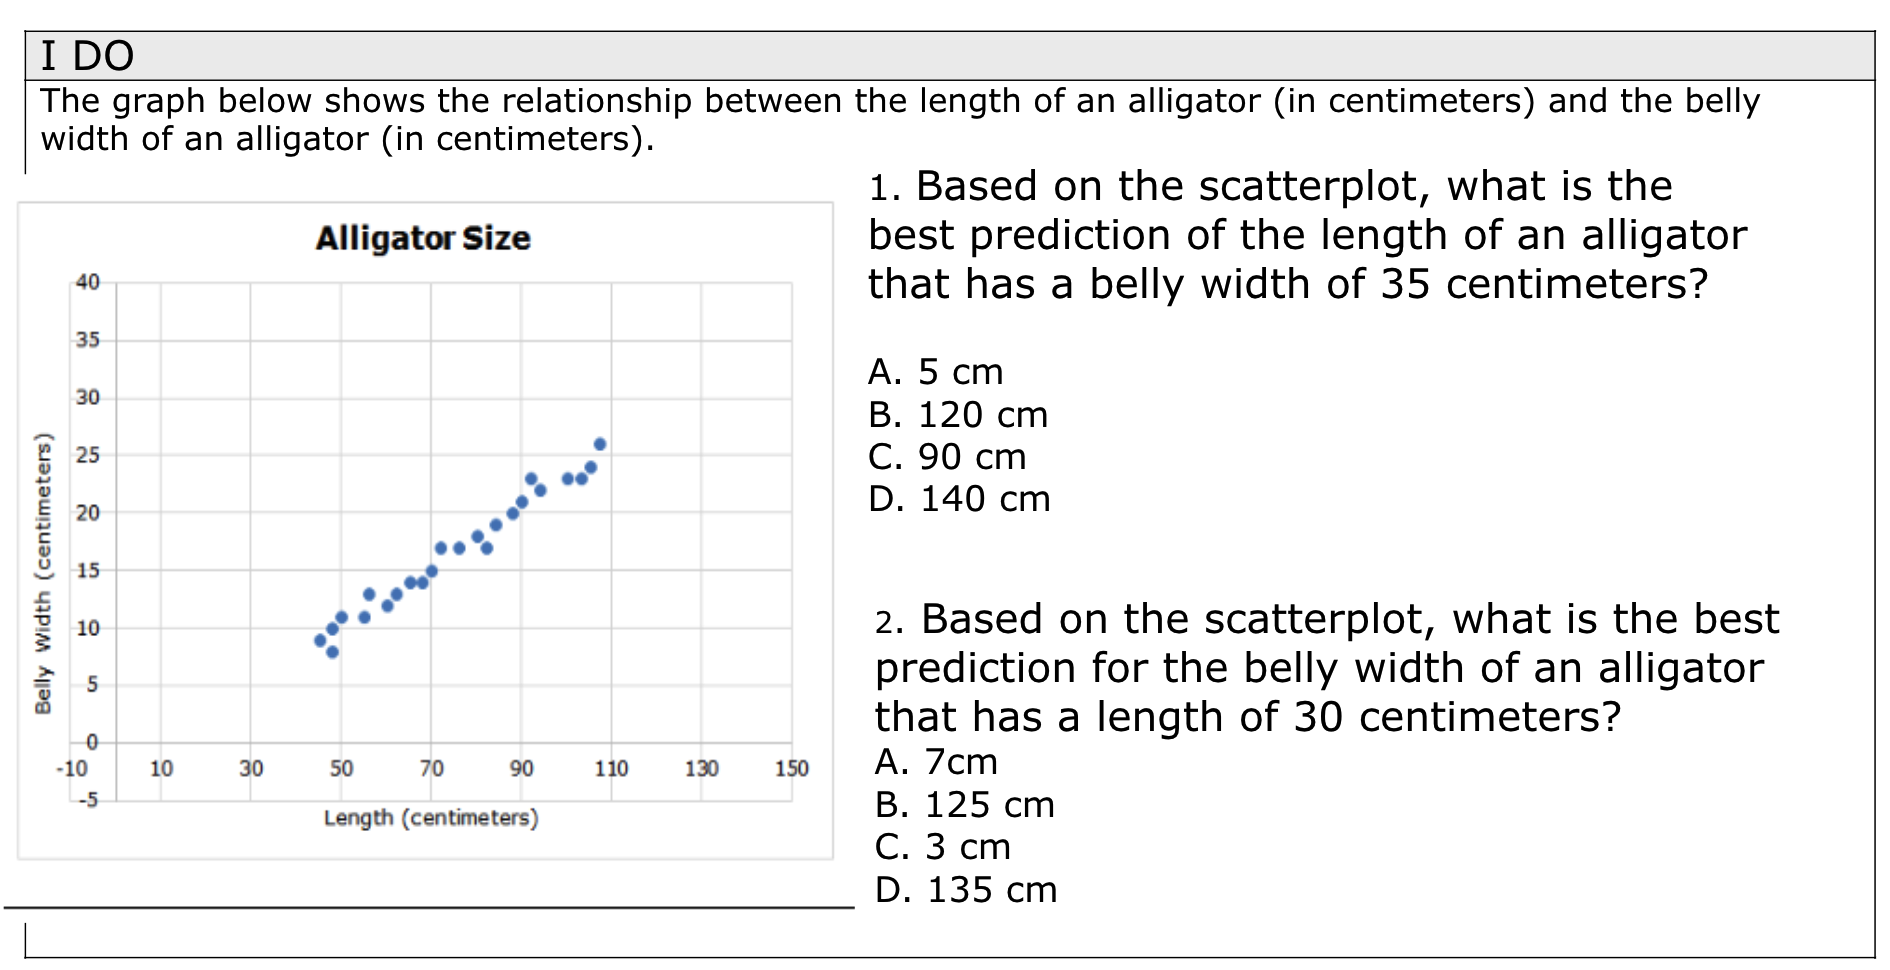
What is the best prediction of the length of an alligator that has a belly width of 35 centimeters.
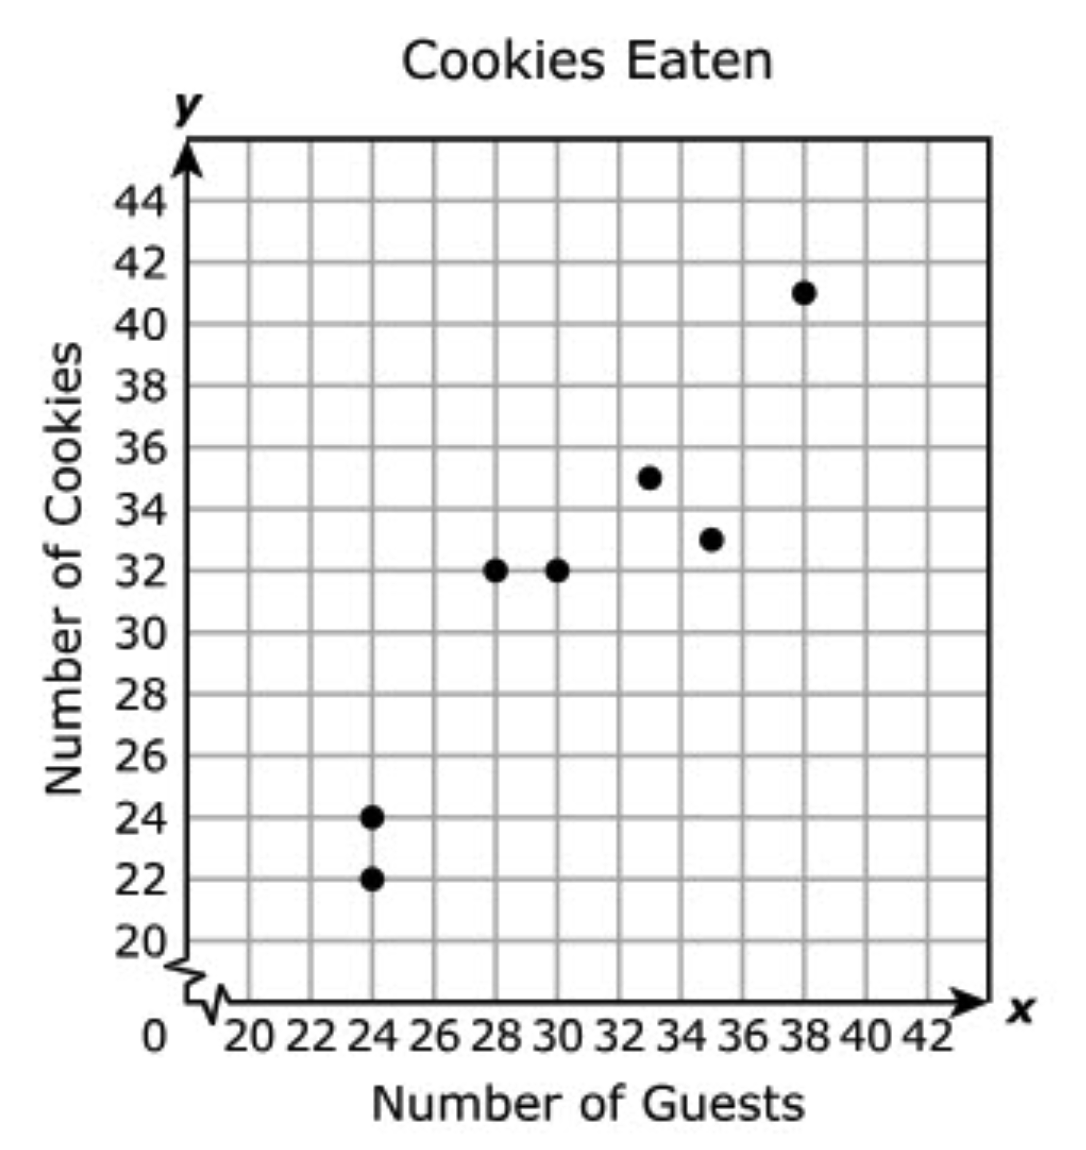
A catering company recorded the total number of cookies that were eaten at events with different number of guest. The scatterplot shows the results.
Based on the scatterplot, approximately how many cookies would be eaten at an event with 45 guest?
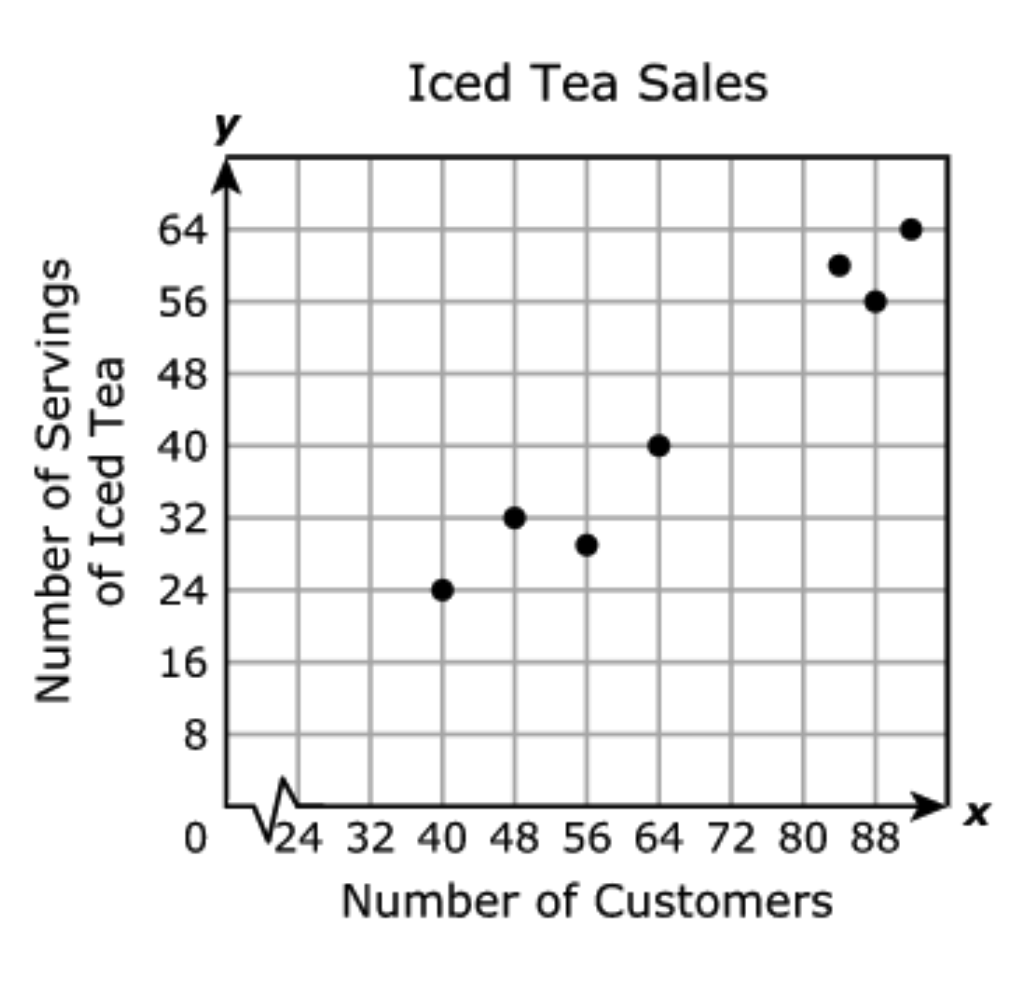
THe scatterplot shows the number of customers and the number of servings of iced tea sold at a food trailer each day over a 7-day period.
Based on the scatterplot, which of these is the best prediction for the number of servings of iced tea where the food trailer has 80 customers?
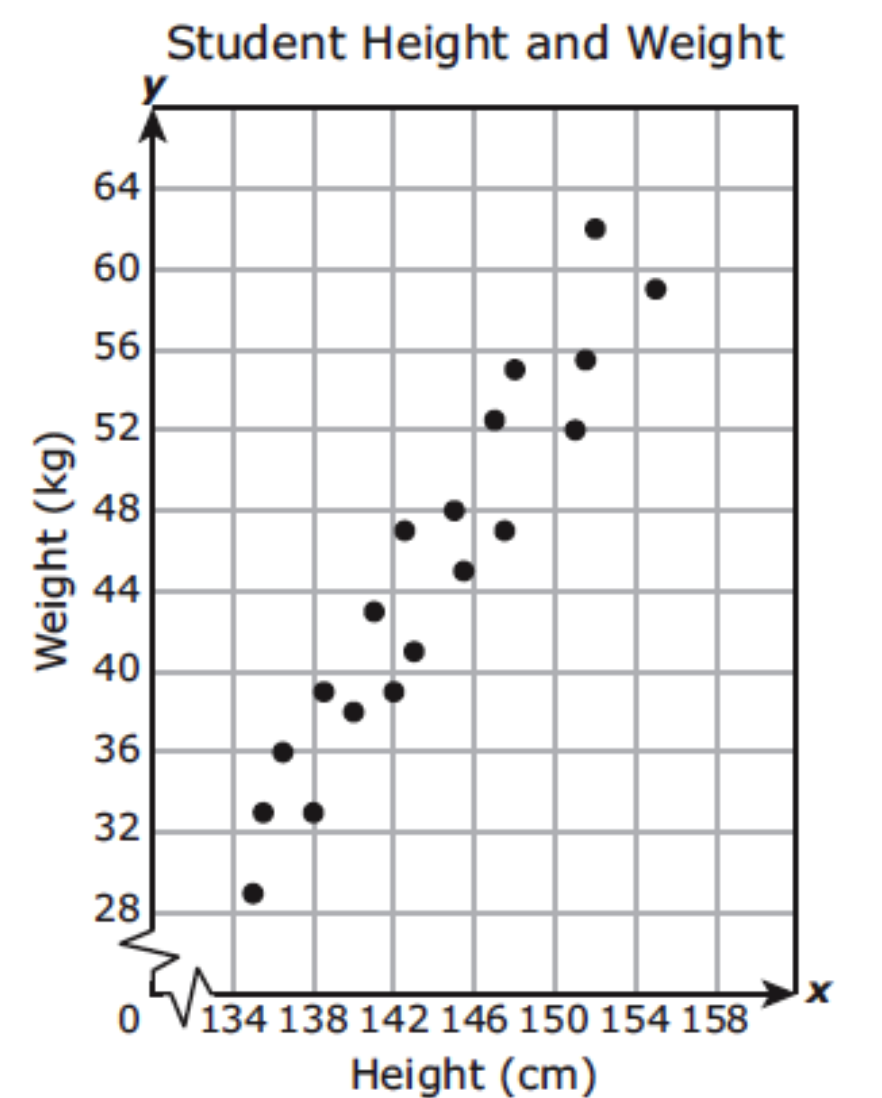
The scatterplot shows the height in centimeters and weight in kilograms of several students.
Base on the scatterplot, which is the best prediction of the height in centimeters of a student with a weight of 64 kilograms?
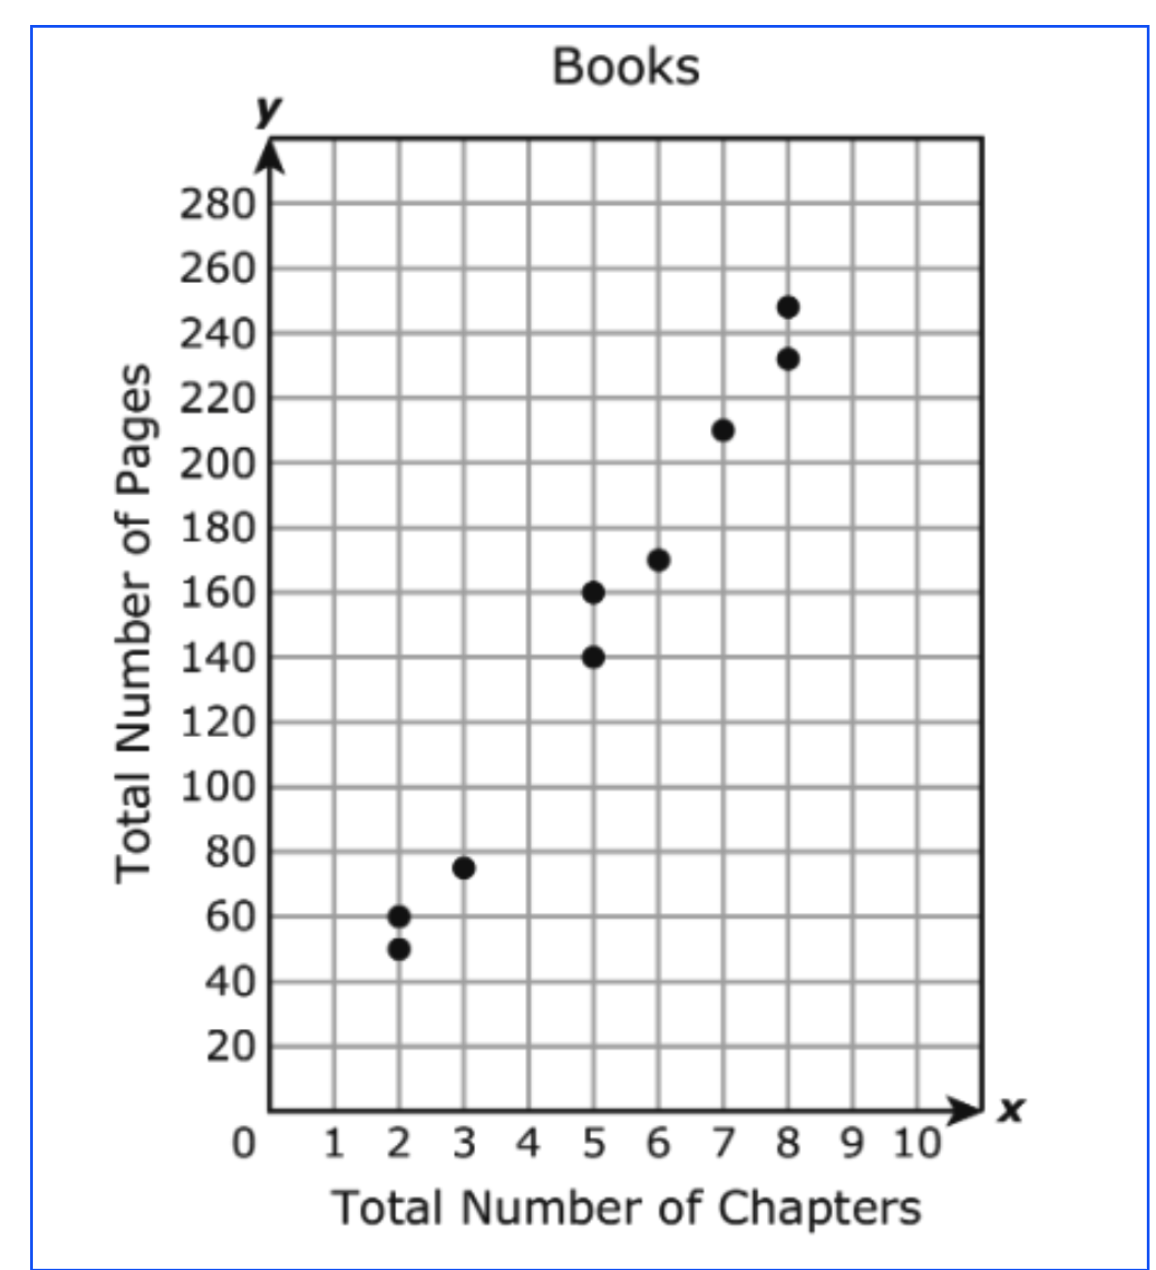
Students recorded the total number of pages and chapters in several books on the scatterplot.
Based on the scatterplot, which is the best prediction of the total number of pages in a book with 4 chapters?
What are the TWO forms of scatterplots?
What is the best prediction for the belly width of an alligator that has a length of 30 centimeters?


