10.4 Quadratic Roots and Discriminants
star
star
star
star
star
Last updated 3 months ago
22 Nsɛmmisa
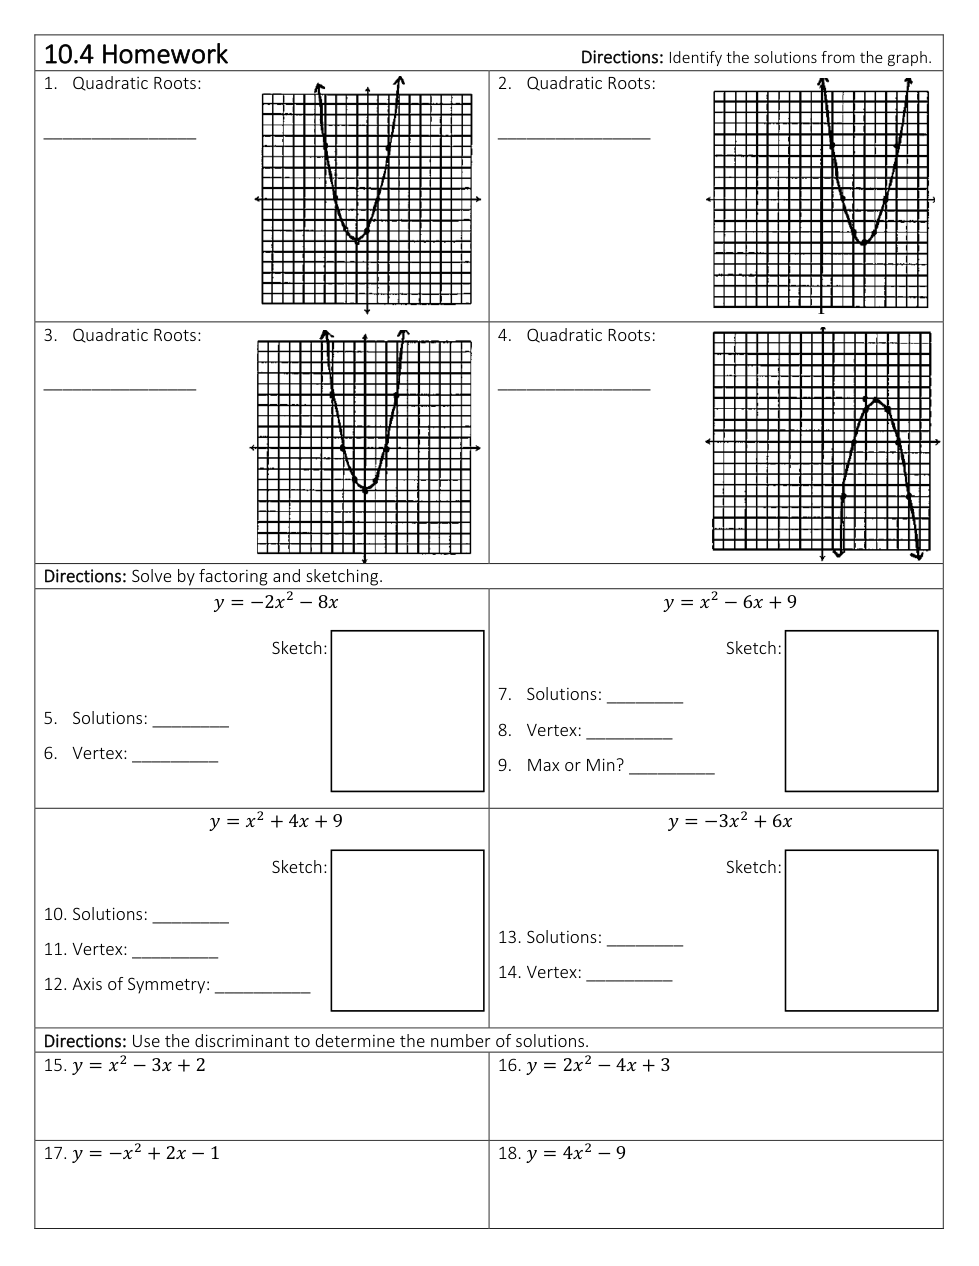
Find the roots.
Find the roots.
Find the roots.
Find the roots.
Find the solutions
Vertex
Graph the Equation
Find the solutions
Vertex
Max or Min?
Graph the Equation
Find the Solutions (Hint: Find the discriminant first)
Axis of Symmetry
vertex
Graph the Equation
Find the Solutions
Vertex
Graph the Equation
Find the number of solutions using the discriminant.
Find the number of solutions using the discriminant.
Find the number of solutions using the discriminant.
Find the number of solutions using the discriminant.