Unit 13 Quiz Review
star
star
star
star
star
Last updated 3 months ago
40 Nsɛmmisa
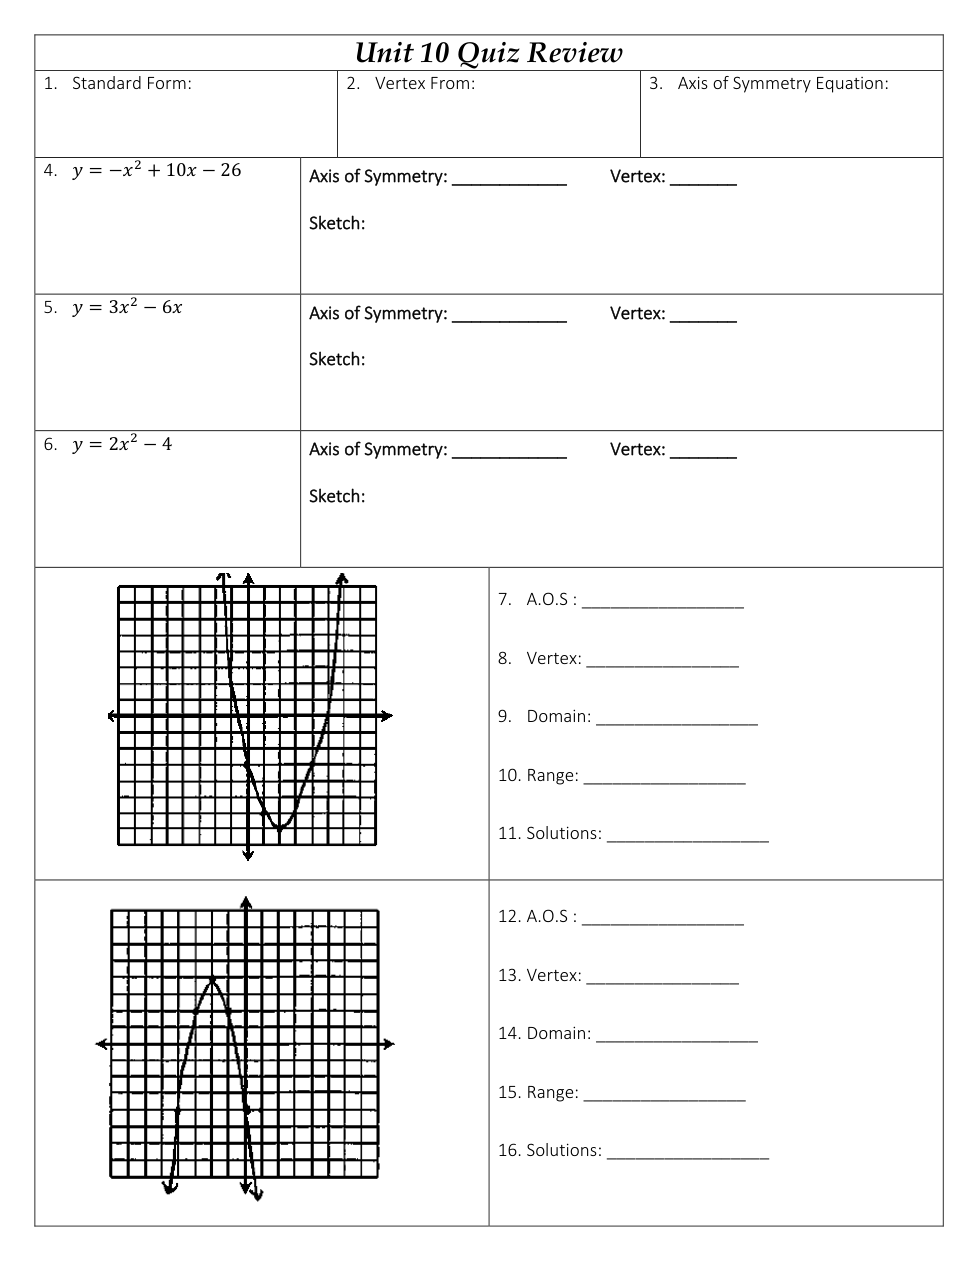
Write the Standard Form for a Quadratic Equation
Write the Vertex form of a Quadratic Equation
Write the axis of symmetry equation
Find the axis of symmetry
Find the vertex
Graph the equation
Find the axis of symmetry
vertex
Graph the Equation
Axis of symmetry
Vertex
Axis of Symmetry
vertex
Domain
Range
Solutions
Axis of symmetry
vertex
Domain
Range
Solutions
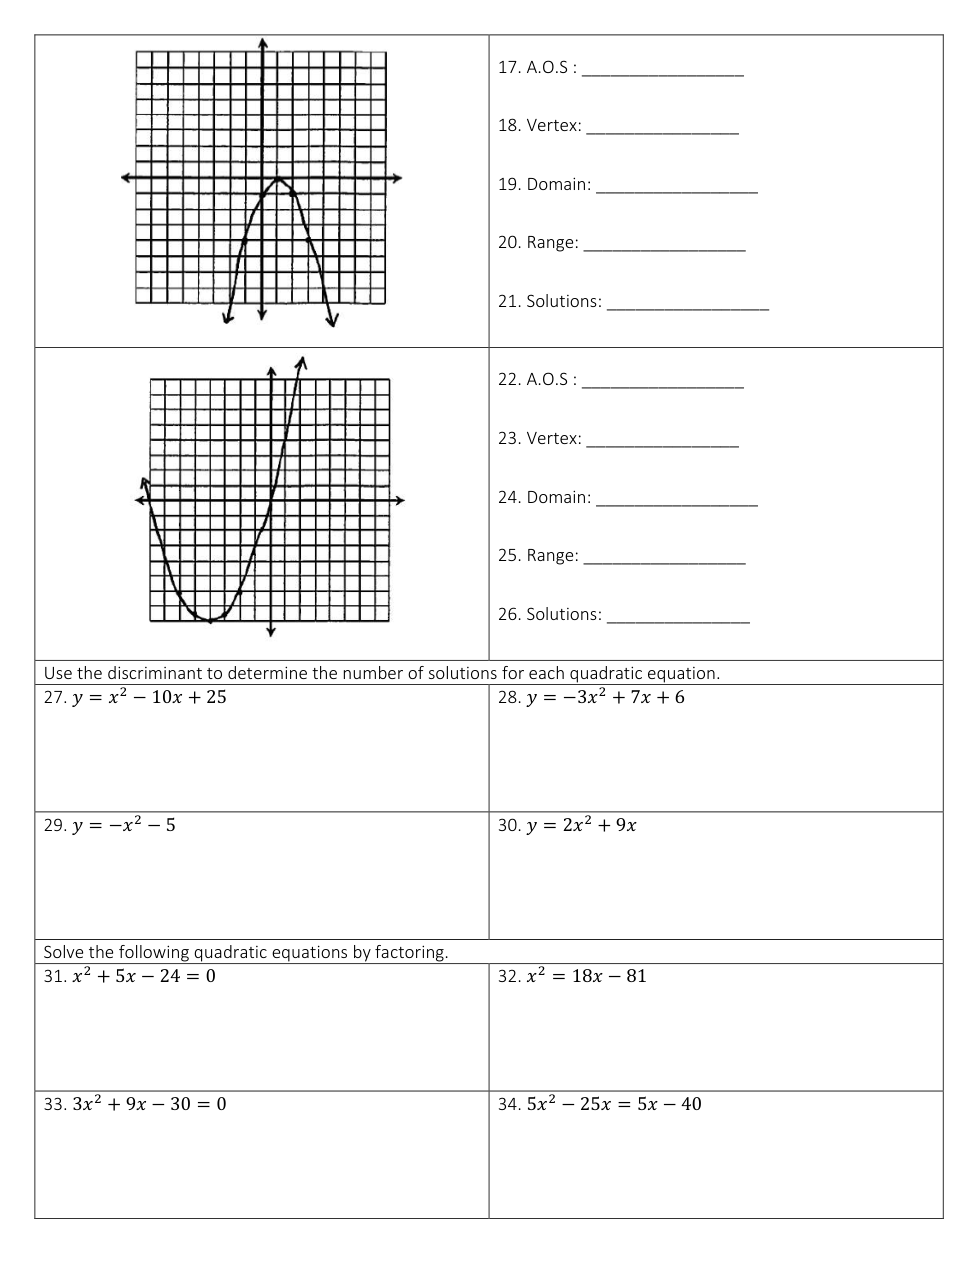
Axis of symmetry
vertex
Domain
Range
Solutions
Axis of symmetry
vertex
Domain
Range
Solutions
Number of Solutions
Number of Solutions
Number of Solutions
Number of Solutions
Solve
Solve
Solve
Solve