Unit 13 Test Review
star
star
star
star
star
Last updated 2 months ago
34 Nsɛmmisa
1
1
1
1
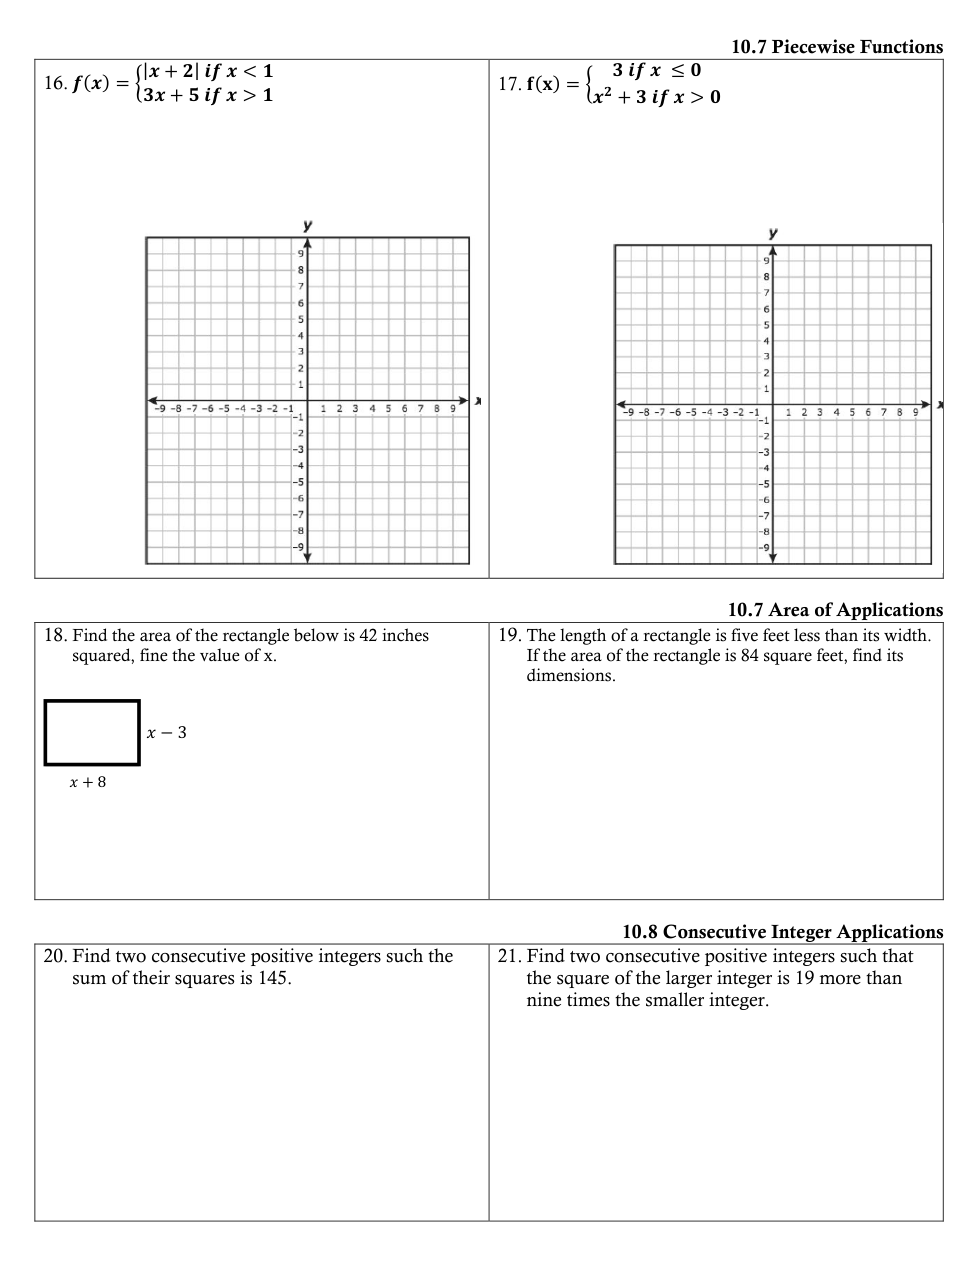
Find x
Find dimensions
Find dimensions
Find dimensions
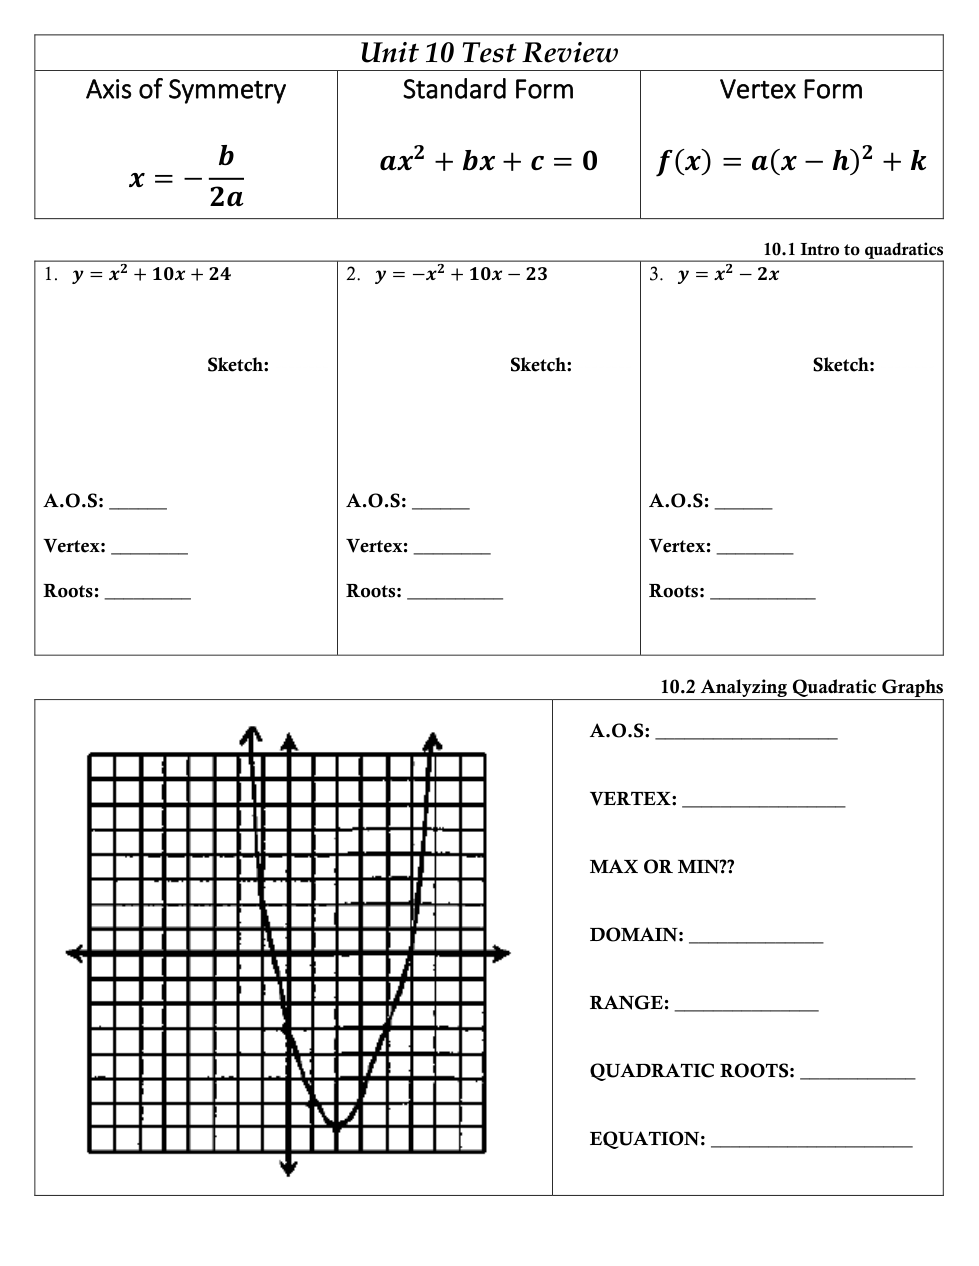
Axis of Symmetry
Vertex
Roots
Sketch
axis of symmetry
Vertex
Roots
Sketch
axis of symmetry
Vertex
Roots
axis of symmetry
vertex
Max or Min?
Domain
Range
Roots
Equation
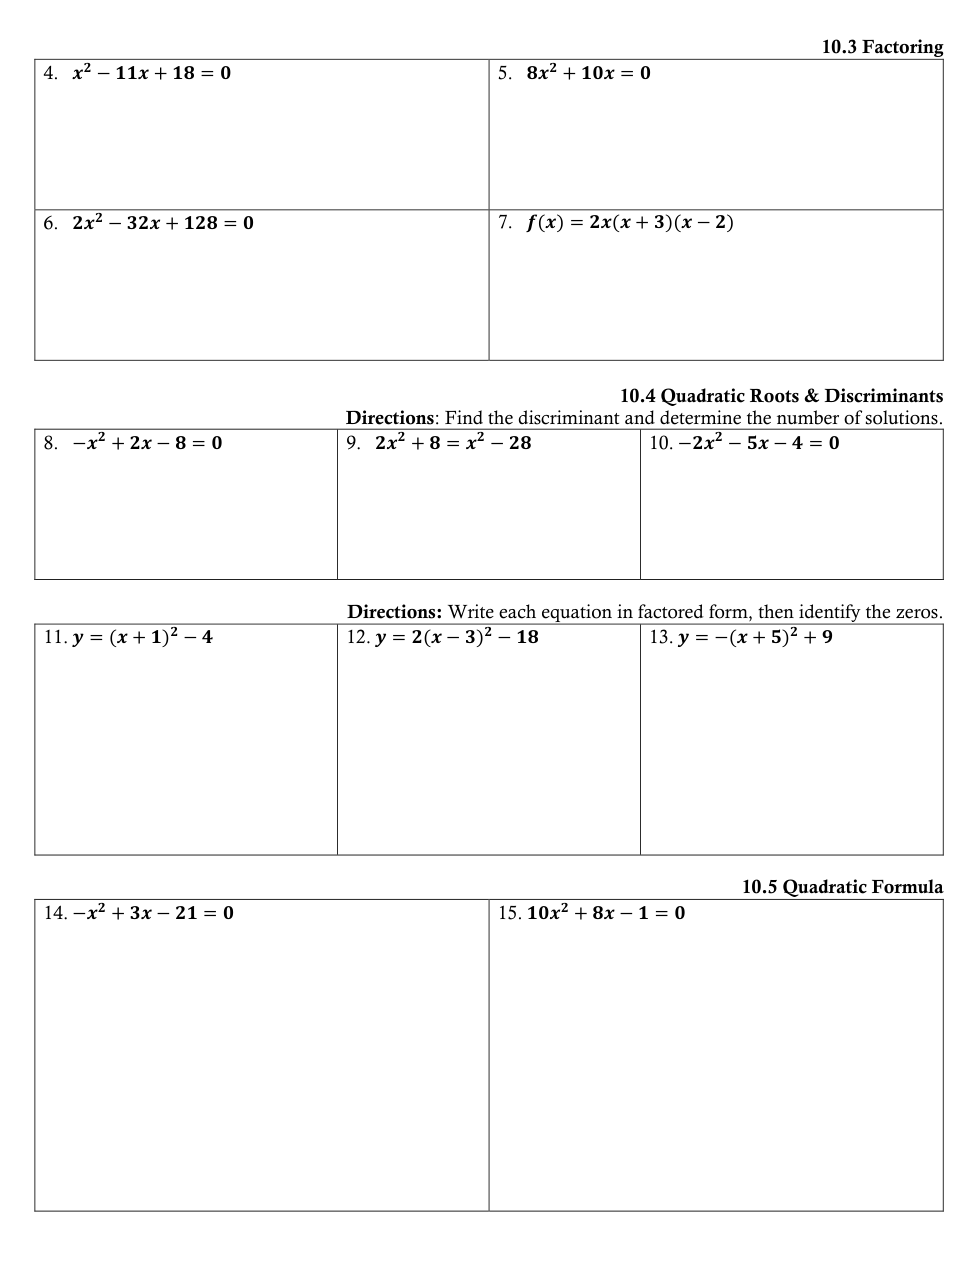
Factor find the zeros.
Factor find the zeros.
Factor find the zeros.
Factor and find the zeros.
Find the number of solutions via the discriminant.
Find the number of solutions via the discriminant.
Find the number of solutions via the discriminant.
Factor and Find the zeros.
Factor and Find the zeros.
Factor and Find the zeros.
Solve using quadratic formula
Solve using quadratic formula