
1
Which of the following statements are supported by the information in the graph?
Select TWO correct answers.
Which of the following statements are supported by the information in the graph?
Select TWO correct answers.
5.9.C
1
5.9.C
You get 3 submissions total. All correct answers will be left alone, while incorrect answers will start new. Show all of your work.
You get 3 submissions total. All correct answers will be left alone, while incorrect answers will start new. Show all of your work.
Which of the following statements are supported by the information in the graph?
Select TWO correct answers.
What is the total number of customers who rated their satisfaction less than 4?
What is the difference, in kilograms, between the least mass and the greatest mass?
Which is supported by the scatterplot?
What is the combined length of the objects that are longer than 14 centimeters?
Which of these statements is supported by the data in the graph?
The frequency tables shows how many hot dogs, pickles, apples, and corn dogs were sold at a concession stand during football season.
How many total hot dogs, pickles, and corn dogs were sold?
Several bags of paper are donated to a recycling center. The stem-&-leaf plot shows the weights of the bags.
What is the difference, in pounds, between the heaviest bag and the lightest bag
A real estate agent created the scatterplot to show the numbers of rooms and windows in homes for sale.
What fraction of the homes have at least 16 windows? Simplify your answer.
How many total pounds of cans did the students collect on day 2?
Based on the frequency table, which statement is true?
The number of customers who gave the company a rating of 1 this year is
How many customers gave the company a rating of 1 last year?
Select whether each statement is TRUE or FALSE.
TRUE | FALSE | |
|---|---|---|
What is the sum of the toys that have a mass of at least 3 kilograms?
How many more absences did the student with the lowest exam score have than the student with the highest exam score?
Mr. Fisher remembered that he had one more exam to grade. The extra student scored 25 points higher than the student who was absent for 6 days. This extra student was absent for 5 fewer days than the student who scored a 55. Which shows the location of the new point Mr. Fisher must plot?
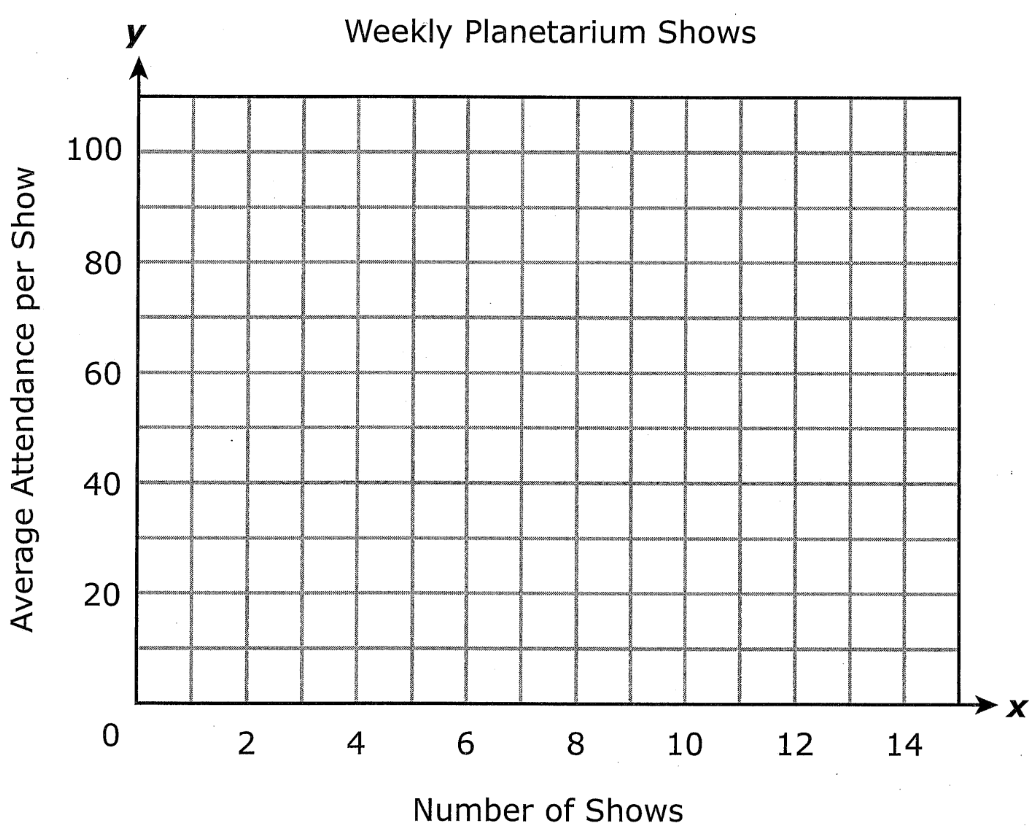
The director of a planetarium wants to know the relationship between the number of weekly shows and the average attendance per show. He collects data for 6 weeks and displays the data on a table. The director wants to display the data on a scatterplot. Plot the points for the data to create a scatterplot on the grid below.
Cara found the sum of the lengths of the two shortest objects. What is the difference, in centimeters, between the longest object and the sum of two shortest objects?
Which school has more than twice as many students who buy their lunch as East Side?
Which is NOT a true statement about Fairview School District?


