Twa kɔ nsɛm atitiriw so
Log in
Sign up for FREE
arrow_back
Laabri

2.07BM Graphing Linear Equations (2/24/2025)

star
star
star
star
star
Last updated 10 months ago
32 Nsɛmmisa
Hyɛ no nsow a efi ɔkyerɛwfo no hɔ:
Intro (Warm-Up)
Learn It
1
1
1
1
1
4
1
2
Application Problems
Application Level 2
Application Level 3 *Bonus, not required*

OBJECTIVES & STANDARDS

Math Objectives

  • Graph a linear equation using slope-intercept form

  • Make connections between sign and size of slope and the graph

Common Core Math Standards

  • Link to all CCSS Math

  • CCSS.PRACTICE.MP4

  • CCSS.PRACTICE.MP7

  • CCSS.HSF.IF.B.4

  • CCSS.HSF.IF.B.5

Personal Finance Objective

  • Apply linear equations to real-world wage scenarios

National Standards for Personal Financial Education

Earning Income

  • 4b: Explain why wages or salaries vary among employees in different types of jobs and among workers in the same jobs

  • 5a: Discuss how economic and labor market conditions can affect income, career opportunities, and employment status

DISTRIBUTION & PLANNING

Distribute to students

  • Student Activity Packet

  • Application Problems

  • Salary Cards (see Application Key for directions

OBJECTIVES & STANDARDS

Math Objectives

  • Graph a linear equation using slope-intercept form

  • Make connections between sign and size of slope and the graph

Common Core Math Standards

  • Link to all CCSS Math

  • CCSS.PRACTICE.MP4

  • CCSS.PRACTICE.MP7

  • CCSS.HSF.IF.B.4

  • CCSS.HSF.IF.B.5

Personal Finance Objective

  • Apply linear equations to real-world wage scenarios

National Standards for Personal Financial Education

Earning Income

  • 4b: Explain why wages or salaries vary among employees in different types of jobs and among workers in the same jobs

  • 5a: Discuss how economic and labor market conditions can affect income, career opportunities, and employment status

DISTRIBUTION & PLANNING

Distribute to students

  • Student Activity Packet

  • Application Problems

  • Salary Cards (see Application Key for directions

COMPARE: ATM Fees

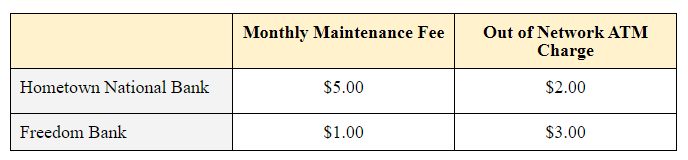
Many banks charge for out of network ATM use.  Out of network ATMs are ones provided by someone other than your bank.  While you’re away at college, you will have to rely on these out of network ATMs if your local bank does not have a branch near your school.

Compare the following checking account fee structures.
1
Asemmisa {{asɛmmisaAhyɛnsode}}
1.

Which bank offers a better fee structure for a month of usage? Describe your reasons.

1
Asemmisa {{asɛmmisaAhyɛnsode}}
2.

Is one bank ALWAYS better?  What factors might affect which bank has the better fee structure?

1
1
1
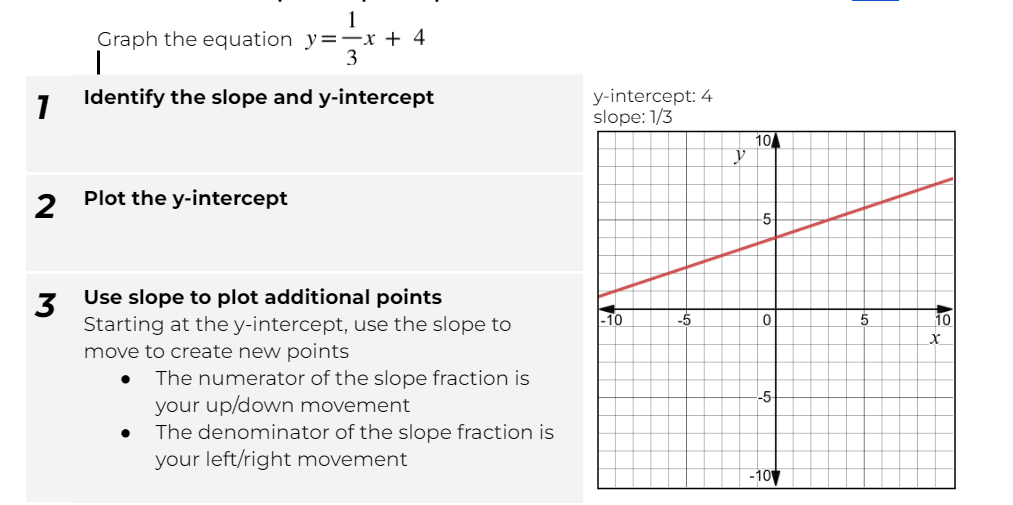
EXAMPLE: Graphing Linear Equations Using Slope-Intercept Form (Video Walkthrough)

  1. Review the example completed problem below. You can see it modeled here

1
Asemmisa {{asɛmmisaAhyɛnsode}}
6.

  • Klik Graph tab (Graph 1, Graph 2, ne nea ɛkeka ho) so ma graph biara a ɛsɛ sɛ wobɔ.
  • Klik graph no akyi na fa asɛm bi ka ho. Fa nsɛntitiriw abien ka ho na yɛ graph. Twe asɛm bi anaa kyerɛw x ne y coordinates na sesa ne gyinabea. Klik asɛm bi so na popa.
  • Sɛ wobɔ wo graph no wie a, wubetumi ahyɛ dashed line box no mu.
  • Sɛ woyɛ graphs nyinaa wie a, klik x anaa y intercept tab so na yɛ intercepts no graph.
1
1
Asemmisa {{asɛmmisaAhyɛnsode}}
9.

  • Klik Graph tab (Graph 1, Graph 2, ne nea ɛkeka ho) so ma graph biara a ɛsɛ sɛ wobɔ.
  • Klik graph no akyi na fa asɛm bi ka ho. Fa nsɛntitiriw abien ka ho na yɛ graph. Twe asɛm bi anaa kyerɛw x ne y coordinates na sesa ne gyinabea. Klik asɛm bi so na popa.
  • Sɛ wobɔ wo graph no wie a, wubetumi ahyɛ dashed line box no mu.
  • Sɛ woyɛ graphs nyinaa wie a, klik x anaa y intercept tab so na yɛ intercepts no graph.
Asemmisa {{asɛmmisaAhyɛnsode}}
10.

  • Klik Graph tab (Graph 1, Graph 2, ne nea ɛkeka ho) so ma graph biara a ɛsɛ sɛ wobɔ.
  • Klik graph no akyi na fa asɛm bi ka ho. Fa nsɛntitiriw abien ka ho na yɛ graph. Twe asɛm bi anaa kyerɛw x ne y coordinates na sesa ne gyinabea. Klik asɛm bi so na popa.
  • Sɛ wobɔ wo graph no wie a, wubetumi ahyɛ dashed line box no mu.
  • Sɛ woyɛ graphs nyinaa wie a, klik x anaa y intercept tab so na yɛ intercepts no graph.
Asemmisa {{asɛmmisaAhyɛnsode}}
11.

  • Klik Graph tab (Graph 1, Graph 2, ne nea ɛkeka ho) so ma graph biara a ɛsɛ sɛ wobɔ.
  • Klik graph no akyi na fa asɛm bi ka ho. Fa nsɛntitiriw abien ka ho na yɛ graph. Twe asɛm bi anaa kyerɛw x ne y coordinates na sesa ne gyinabea. Klik asɛm bi so na popa.
  • Sɛ wobɔ wo graph no wie a, wubetumi ahyɛ dashed line box no mu.
  • Sɛ woyɛ graphs nyinaa wie a, klik x anaa y intercept tab so na yɛ intercepts no graph.
Asemmisa {{asɛmmisaAhyɛnsode}}
12.

  • Klik Graph tab (Graph 1, Graph 2, ne nea ɛkeka ho) so ma graph biara a ɛsɛ sɛ wobɔ.
  • Klik graph no akyi na fa asɛm bi ka ho. Fa nsɛntitiriw abien ka ho na yɛ graph. Twe asɛm bi anaa kyerɛw x ne y coordinates na sesa ne gyinabea. Klik asɛm bi so na popa.
  • Sɛ wobɔ wo graph no wie a, wubetumi ahyɛ dashed line box no mu.
  • Sɛ woyɛ graphs nyinaa wie a, klik x anaa y intercept tab so na yɛ intercepts no graph.
Asemmisa {{asɛmmisaAhyɛnsode}}
13.

  • Klik Graph tab (Graph 1, Graph 2, ne nea ɛkeka ho) so ma graph biara a ɛsɛ sɛ wobɔ.
  • Klik graph no akyi na fa asɛm bi ka ho. Fa nsɛntitiriw abien ka ho na yɛ graph. Twe asɛm bi anaa kyerɛw x ne y coordinates na sesa ne gyinabea. Klik asɛm bi so na popa.
  • Sɛ wobɔ wo graph no wie a, wubetumi ahyɛ dashed line box no mu.
  • Sɛ woyɛ graphs nyinaa wie a, klik x anaa y intercept tab so na yɛ intercepts no graph.
Asemmisa {{asɛmmisaAhyɛnsode}}
14.

Graph the following equations:

Graph 1: y=2x+1

Graph 2: y=-2x+1

Graph 3: y=1/2x+1

Graph 4: y=-1/2x+1

  • Klik Graph tab (Graph 1, Graph 2, ne nea ɛkeka ho) so ma graph biara a ɛsɛ sɛ wobɔ.
  • Klik graph no akyi na fa asɛm bi ka ho. Fa nsɛntitiriw abien ka ho na yɛ graph. Twe asɛm bi anaa kyerɛw x ne y coordinates na sesa ne gyinabea. Klik asɛm bi so na popa.
  • Sɛ wobɔ wo graph no wie a, wubetumi ahyɛ dashed line box no mu.
Asemmisa {{asɛmmisaAhyɛnsode}}
15.

Graph the following equations:

  • Klik Graph tab (Graph 1, Graph 2, ne nea ɛkeka ho) so ma graph biara a ɛsɛ sɛ wobɔ.
  • Klik graph no akyi na fa asɛm bi ka ho. Fa nsɛntitiriw abien ka ho na yɛ graph. Twe asɛm bi anaa kyerɛw x ne y coordinates na sesa ne gyinabea. Klik asɛm bi so na popa.
  • Sɛ wobɔ wo graph no wie a, wubetumi ahyɛ dashed line box no mu.
Asemmisa {{asɛmmisaAhyɛnsode}}
16.

Compare graphs in your group.

How does the sign of the slope affect the graph of the equation?

How does the size of the slope change the graph of the equation?

Comparing Compensation

Congratulations on being hired! Please flip over your wage card to see how much you’ll be making at your new job. On your first day, you’re discussing your compensation with the other new hires in your group.

Part 1: Equations

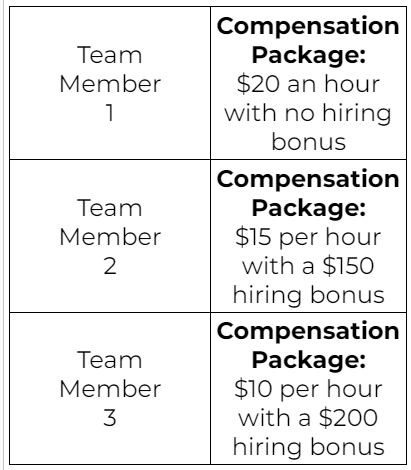
  1. Write an equation that represents each team member’s compensation. Your equation should represent a relationship between hours worked (x) and total pay (y). Please put the equation for each team member in the boxes below.

Team Member 1

Team Member 2

Team Member 3

  1. Using the equations that you wrote, who do you think got the best compensation deal?

  2. What does the slope represent in each equation?

  3. What does the y-intercept represent in each equation?

6
Asemmisa {{asɛmmisaAhyɛnsode}}
17.

*If present, please do this on your paper in your notebook. If absent, this is your make up work. *

Part 1: Equations

  1. Write an equation that represents each team member’s compensation. Your equation should represent a relationship between hours worked (x) and total pay (y). Please put the equation for each team member in the boxes below.

Team Member 1

Team Member 2

Team Member 3

  1. Using the equations that you wrote, who do you think got the best compensation deal?

  2. What does the slope represent in each equation?

  3. What does the y-intercept represent in each equation?

0

Part 3: Reflect

Well done! Your final task is to answer the questions below. You can use either the equations or the graph to help you complete the questions.

1
1

Part 1: Minimum Wage

Minimum wage is the lowest hourly wage that an employer can pay you. Each state sets its own minimum wage but that wage must be at least $7.25 per hour, which is the national minimum wage set by the federal government.

1
Asemmisa {{asɛmmisaAhyɛnsode}}
21.

What is the minimum wage in your state? Visit MinimumWage.com and write your answer below.

1
Asemmisa {{asɛmmisaAhyɛnsode}}
22.

What is the average monthly rent in your state? Visit World Population Review and write your answer below.

1
1
1
1
1

A Living Wage

  1. Visit MIT Living Wage Calculator

  2. Click your state

  3. Click your county

Consider each of the households living in your county.

  • Family 1: A married couple with one child: Due to the high cost of childcare, one parent stays home to care for the child while the other works 40 hours per week making $18 per hour. They also receive a monthly stipend of $50 to cover work related expenses.

  • Family 2: A married couple with two children who are in school. Both adults are working 40 hours per week with one making $16 per hour while the other makes minimum wage. One of these workers pays $25 per month in union dues.

  • Family 3: A fulltime student who only has the time to work 20 hours per week making $2 more than the minimum wage. They have a gerbil as a pet.

0
Asemmisa {{asɛmmisaAhyɛnsode}}
28.

Part 1: Equations

  1. Write an equation for the monthly wages of each family, including any bonuses or wage reduction.

Family 1

Family 2

Family 3

0
0
Asemmisa {{asɛmmisaAhyɛnsode}}
30.

Part 3: Reflect

A living wage is defined as “the hourly rate that an individual in a household must earn to support his or herself and their family.” Using the information provided on the MIT Living Wage Calculator, do any of the families make enough to earn a living wage?

0
Asemmisa {{asɛmmisaAhyɛnsode}}
31.

Based on the Typical Expenses section for your county on the MIT Living Wage Calculator, how many hours does each family need to work per month to cover housing expenses. (Note that the values in Typical Expenses section are ANNUAL expenses, so you will need to divide by 12 to get MONTHLY expense

0
Asemmisa {{asɛmmisaAhyɛnsode}}
3.

How could you avoid these fees if you are away at school without access to a local branch?

Asemmisa {{asɛmmisaAhyɛnsode}}
4.

Find a partner and discuss your bank choices. Write down how you could best compare the two fee structures.

Asemmisa {{asɛmmisaAhyɛnsode}}
5.

https://drive.google.com/file/d/1APJT1T-DMD_bCu_ooTSrgeFDfvqaG68F/view

After viewing this graph, how does the graph help you analyze the bank fees?

Asemmisa {{asɛmmisaAhyɛnsode}}
7.

Graph the equation: y= - 3x

  • Klik Graph tab (Graph 1, Graph 2, ne nea ɛkeka ho) so ma graph biara a ɛsɛ sɛ wobɔ.
  • Klik graph no akyi na fa asɛm bi ka ho. Fa nsɛntitiriw abien ka ho na yɛ graph. Twe asɛm bi anaa kyerɛw x ne y coordinates na sesa ne gyinabea. Klik asɛm bi so na popa.
  • Sɛ wobɔ wo graph no wie a, wubetumi ahyɛ dashed line box no mu.
  • Sɛ woyɛ graphs nyinaa wie a, klik x anaa y intercept tab so na yɛ intercepts no graph.
Asemmisa {{asɛmmisaAhyɛnsode}}
8.

y=x - 5

  • Klik Graph tab (Graph 1, Graph 2, ne nea ɛkeka ho) so ma graph biara a ɛsɛ sɛ wobɔ.
  • Klik graph no akyi na fa asɛm bi ka ho. Fa nsɛntitiriw abien ka ho na yɛ graph. Twe asɛm bi anaa kyerɛw x ne y coordinates na sesa ne gyinabea. Klik asɛm bi so na popa.
  • Sɛ wobɔ wo graph no wie a, wubetumi ahyɛ dashed line box no mu.
  • Sɛ woyɛ graphs nyinaa wie a, klik x anaa y intercept tab so na yɛ intercepts no graph.
Asemmisa {{asɛmmisaAhyɛnsode}}
18.

*We found this difficult to graph in Formative& Desmos due to the size of the graph. Please refer to the picture below for reference and answer questions 19-27.

  • Klik Graph tab (Graph 1, Graph 2, ne nea ɛkeka ho) so ma graph biara a ɛsɛ sɛ wobɔ.
  • Klik graph no akyi na fa asɛm bi ka ho. Fa nsɛntitiriw abien ka ho na yɛ graph. Twe asɛm bi anaa kyerɛw x ne y coordinates na sesa ne gyinabea. Klik asɛm bi so na popa.
  • Sɛ wobɔ wo graph no wie a, wubetumi ahyɛ dashed line box no mu.
Asemmisa {{asɛmmisaAhyɛnsode}}
19.

If each team member works 30 hours next week, which member of your team has the best compensation package?

Asemmisa {{asɛmmisaAhyɛnsode}}
20.

During which range of hours is each team member’s compensation package the most beneficial? (For example: “From 10 hours to 18 hours, Team Member 99 makes the most money”)

Asemmisa {{asɛmmisaAhyɛnsode}}
23.

Write an equation for your state’s minimum wage where x represents hours worked and y represents total pay.

Asemmisa {{asɛmmisaAhyɛnsode}}
24.

There have been proposals to increase the federal minimum wage to $15 per hour. Write an equation for representing a $15 minimum wage where x represents hours worked and y represents total pay

Part 2: Reflect

Open this Desmos Graph and enter equations for minimum wage and one representing the $15 minimum wage, then use the point sliders to answer the questions below.

Asemmisa {{asɛmmisaAhyɛnsode}}
25.

How many hours would you need to work to pay for one month of rent in your state if you were paid minimum wage?

Asemmisa {{asɛmmisaAhyɛnsode}}
26.

How many more hours would you need to work to pay rent if the minimum wage was to $7.25 per hour?

Asemmisa {{asɛmmisaAhyɛnsode}}
27.

A common guideline given by financial advisors is that you should spend no more than 30% of your gross income on rent. Assume you work 160 hours per month (~40 hours per week). What percentage of pay is being used to pay for rent in your state if you make:

  1. Minimum wage?

  2. $15 per hour?

Asemmisa {{asɛmmisaAhyɛnsode}}
29.

Part 2: Graph

Graph each equation on the same grid, using different colors to represent each family.

  • Klik Graph tab (Graph 1, Graph 2, ne nea ɛkeka ho) so ma graph biara a ɛsɛ sɛ wobɔ.
  • Klik graph no akyi na fa asɛm bi ka ho. Fa nsɛntitiriw abien ka ho na yɛ graph. Twe asɛm bi anaa kyerɛw x ne y coordinates na sesa ne gyinabea. Klik asɛm bi so na popa.
  • Sɛ wobɔ wo graph no wie a, wubetumi ahyɛ dashed line box no mu.
Asemmisa {{asɛmmisaAhyɛnsode}}
32.

Family 1 and Family 2’s lines intersect. What does that intersection represent in the context of hours worked and wages?