1
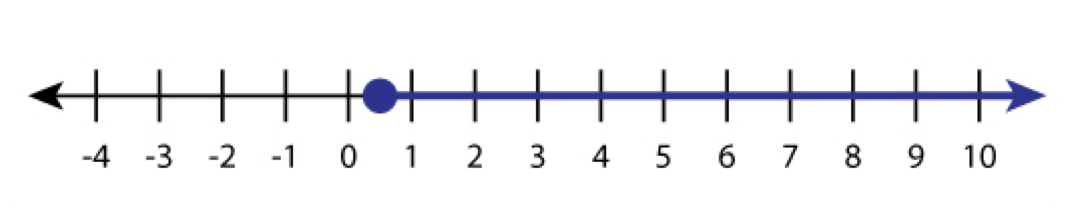
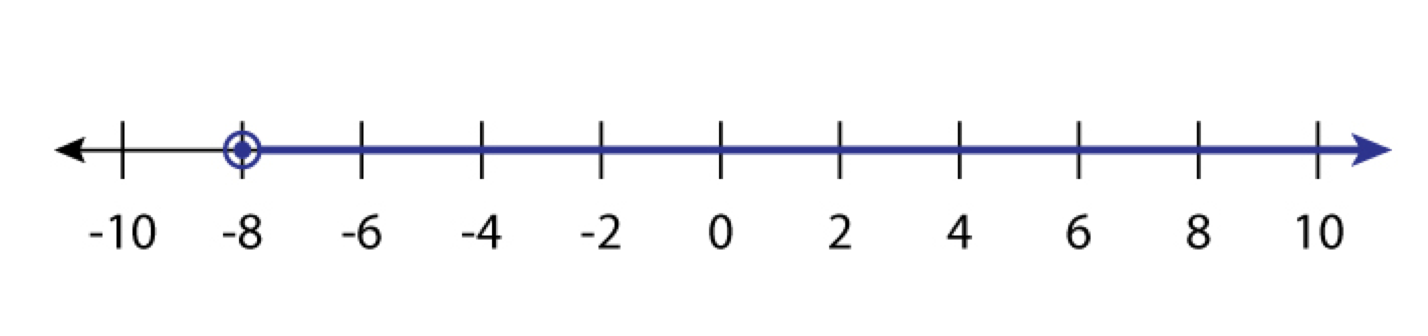
Which solution does the graph show?
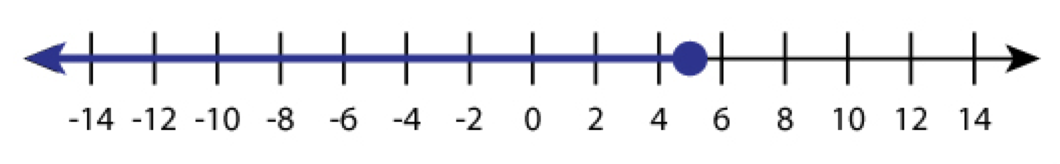
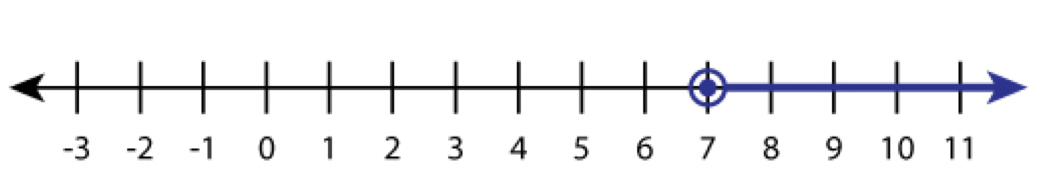
Which solution does the graph show?
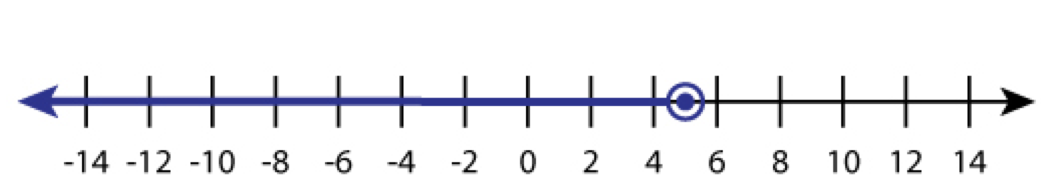
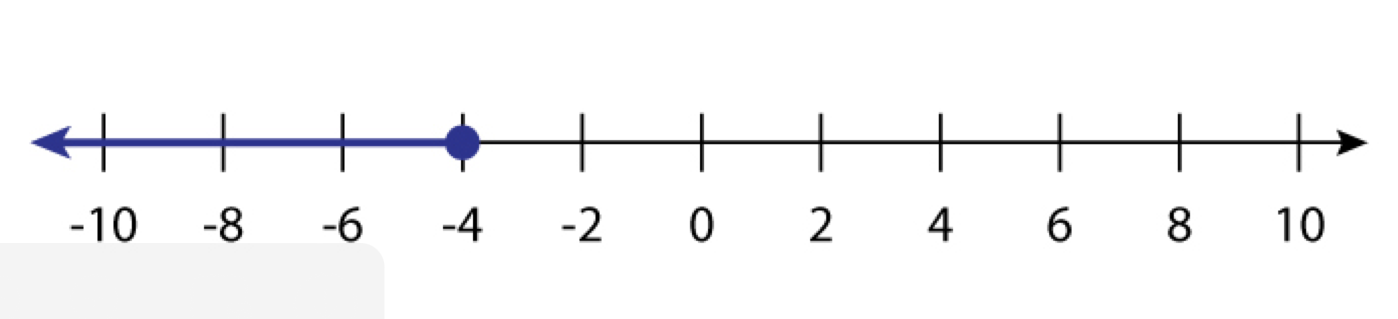
Which solution does the graph show?
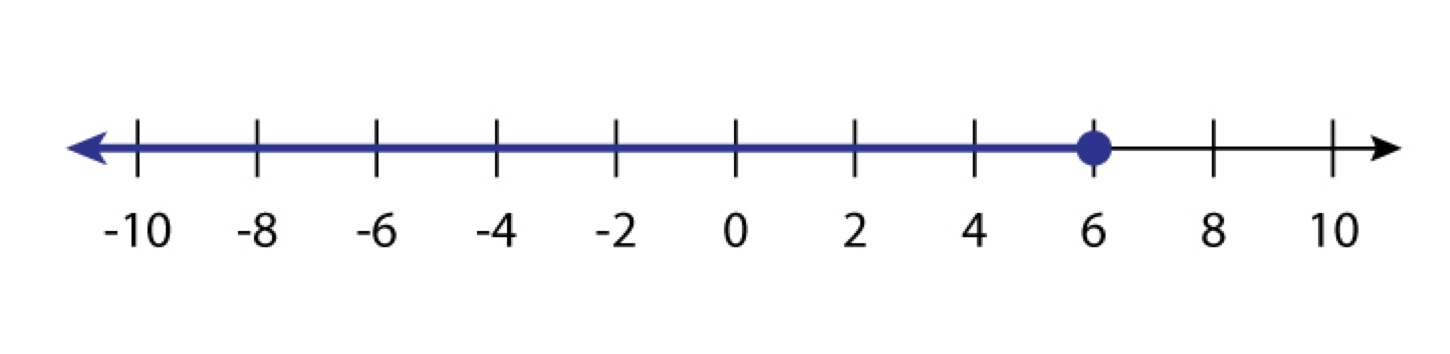
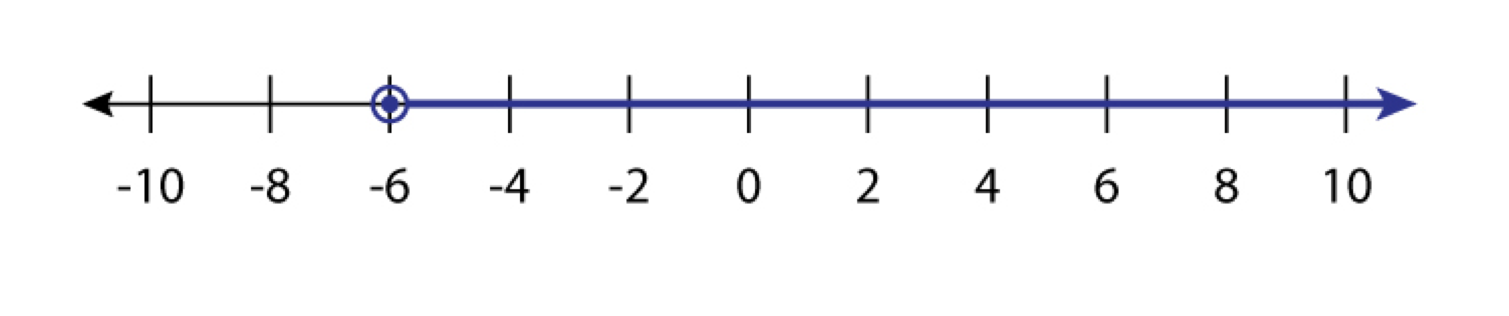
Which solution does the graph show?
Which solution does the graph show?
Which solution does the graph show?
Which solution does the graph show?
Which solution does the graph show?
Which solution does the graph show?
What solution does the graph show?
What does the inequality x < 3 look like on a number line?
What does the inequality x > 2 look like on a number line?
Which number line represents x< -2?
Choose the correct graph for x>0.
