1-08 Seed Growth
star
star
star
star
star
Last updated over 1 year ago
17 Nsɛmmisa
Each previous output is?
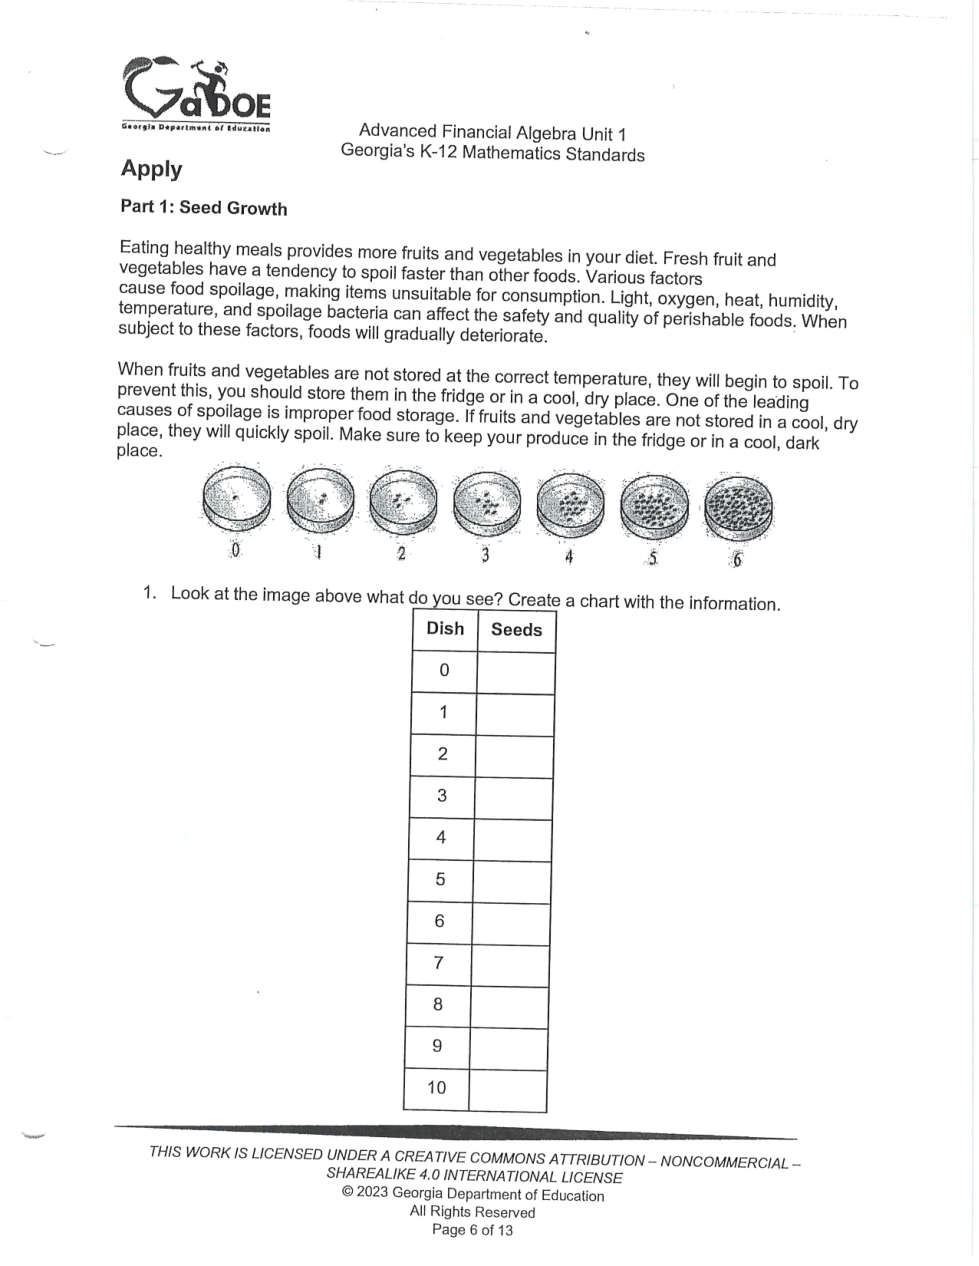
X values are the dish column
Y Values are the seed column
What happens to the seed
What happens to the rate of the seeds over time?
The equations is: