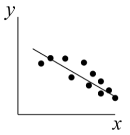
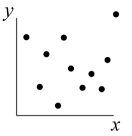
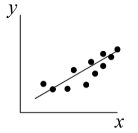
Match the graph with the description
Match the graph with the description
| Draggable item | arrow_right_alt | Corresponding Item |
|---|---|---|
| arrow_right_alt | Positive Correlation | |
| arrow_right_alt | Negative Correlation | |
| arrow_right_alt | No correlation |
Choose any combination of questions that adds up to 5 points. Your score will be based on whether you get the questions right/wrong. If the question says to show your work, you need to show it to get credit.
Note: If you want to do more than 5 points worth of questions to cover yourself in case you get one wrong, you can definitely do that! The max grade is still 5 points.
You MAY use:
My Notes
Your Notes
Other Formatives
A calculator
You MAY NOT use:
AI
Another human
Your genius talking parrot or any other animals or otherworldly beings
Choose any combination of questions that adds up to 5 points. Your score will be based on whether you get the questions right/wrong. If the question says to show your work, you need to show it to get credit.
Note: If you want to do more than 5 points worth of questions to cover yourself in case you get one wrong, you can definitely do that! The max grade is still 5 points.
You MAY use:
My Notes
Your Notes
Other Formatives
A calculator
You MAY NOT use:
AI
Another human
Your genius talking parrot or any other animals or otherworldly beings
Each of the following is a convenience of online banking EXCEPT…
Which person-to-person payment activity will likely result in your paying a fee?
Match the graph with the description
| Draggable item | arrow_right_alt | Corresponding Item |
|---|---|---|
| arrow_right_alt | Positive Correlation | |
| arrow_right_alt | Negative Correlation | |
| arrow_right_alt | No correlation |
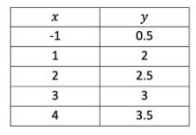
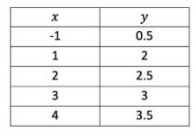
Enter the data into desmos, add your screenshot to the show your work box.
Does the data appear to have a relationship? If so, what type (pos or neg)
Enter the data into desmos and find the linear regression (remember, the formula is y1~mx1+b)
Regression equation
Use your model to estimate the value of y when x is 10
Put a screenshot of your work in the show your work box
Enter the data from the word problem into desmos and find the linear regression (remember, the formula is y1~mx1+b)
Tiny Town had a population of 100 people in the first year it is built. We will call that year 0. After that, the population is as shown below. Use desmos to plot the data for years 0-4. Then find the regression equation.
0 - 100
1 - 120
2 - 138
3 - 162
4 - 180
Regression equation
Use your model to estimate the population of Tiny Town in year 15
Put a screenshot of your work in the show your work box