Dot Plots and Histograms
star
star
star
star
star
Last updated over 1 year ago
25 Nsɛmmisa
1
1
1
1
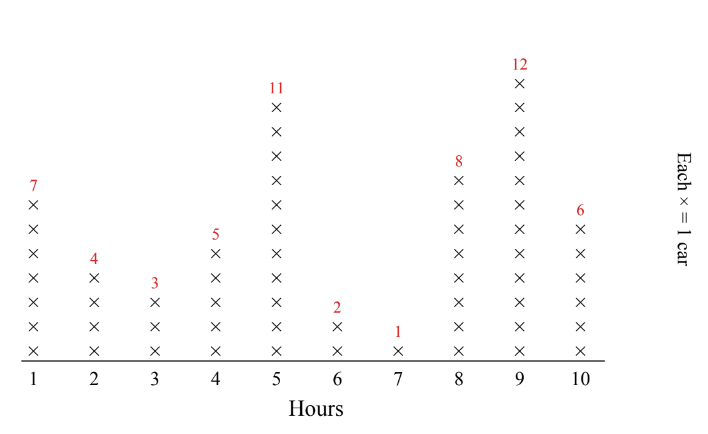
How many cars did she sell in hour 6?
Did she sell more cars in hour 6 or in hour 3?
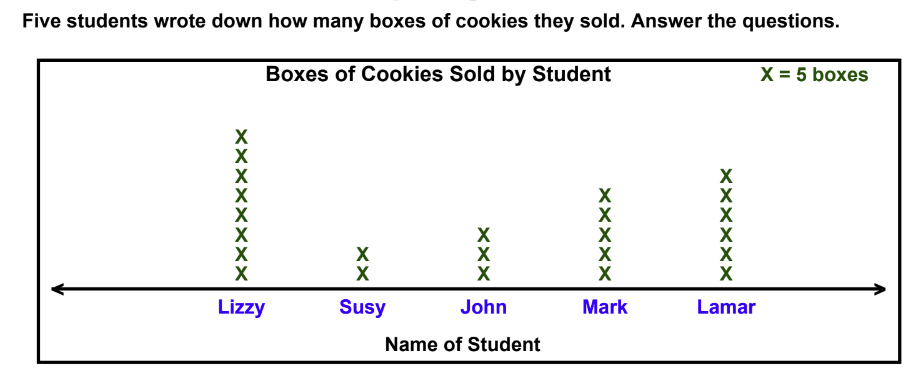
How many boxes of cookies did Lizzy sell?
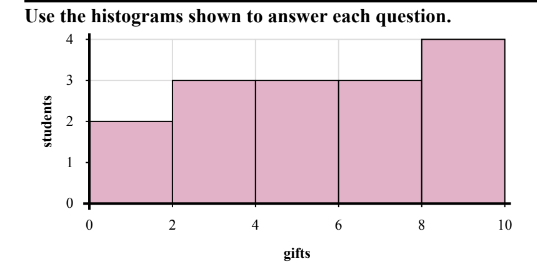
How many students received between 0 and 2 gifts?
How many students are represented in this histogram?
If a student received 6 gifts which bar would they be added to?
Most students received between _____ and _____ gifts.
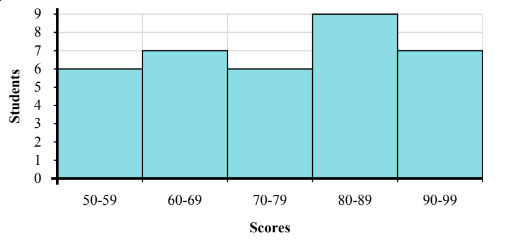
How many students are represented in this histogram?
How many students scored between a 50 and 60?
What is the difference in the number of cars she sold in hour 5 and the number she sold in hour 10?
What is the combined number of cars she sold in hour 9 and in hour 8?
Which hour did she sell the fewest cars?
Did she sell fewer cars in hour 2 or in hour 8?
She sold the most cars which hour?
Which hour did she sell exactly 11 cars?
Which student sold the most boxes of cookies?
How many cookie boxes did Mark sell?
In total, how many boxes of cookies did the students sell?
How many boxes of cookies did the girls (Lizzy and Susy) sell?
Did John or Susy sell more boxes of cookies?
Which student sold the fewest boxes of cookies?
How many boxes of cookies were sold by Lamar?
Which student(s) (if any) sold more than 30 boxes of cookies?
Most students scored between a _____ and _____.
If a student scored a 54 which bar would they be added to?