1
Some Cats are not Mammals.
Some Cats are not Mammals.
1
1
1
Some Cats are not Mammals.
Click on the area(s) of the Venn Diagram that represents people who like Ice Cream.
Select All that Apply.
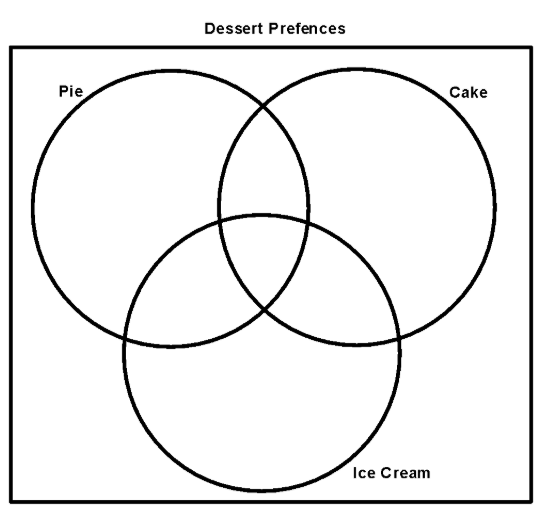
Click on the area(s) of the Venn Diagram that represents people who ONLY like Ice Cream.
Select All that Apply.
Click on the area(s) of the Venn Diagram that represents people who like Pie and Cake.
Select All that Apply.
Click on the area(s) of the Venn Diagram that represents people who like Pie or Cake.
Select All that Apply.
Click on the area(s) of the Venn Diagram that represents people who like Ice Cream and Cake, but not Pie.
Select All that Apply.
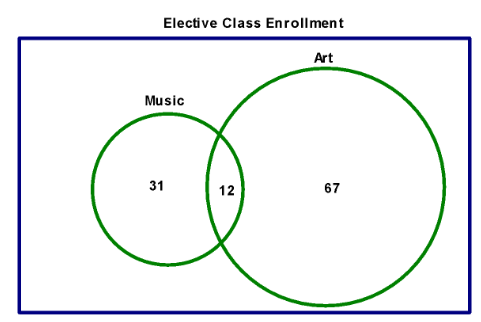
The following Venn diagram was constructed from asking 127 students at Clover High School if they were enrolled in a music class or an art class.
How many students take a music class?
The following Venn diagram was constructed from asking 127 students at Clover High School if they were enrolled in a music class or an art class.
How many students only take an Art class?
The following Venn diagram was constructed from asking 127 students at Clover High School if they were enrolled in a music class or an art class.
How many students take an Art class or a Music class?
The following Venn diagram was constructed from asking 127 students at Clover High School if they were enrolled in a music class or an art class.
How many students do not take an Art class or a Music class?
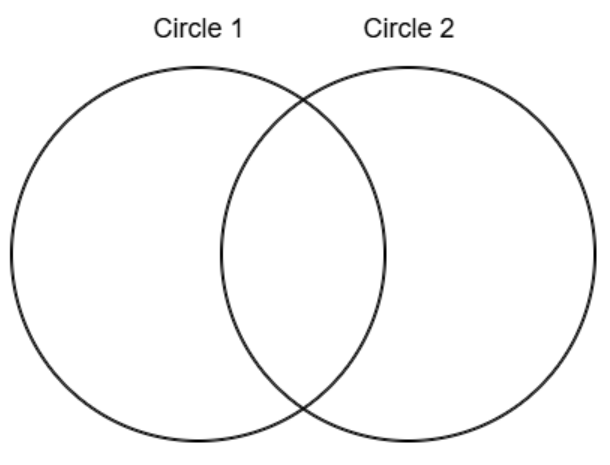
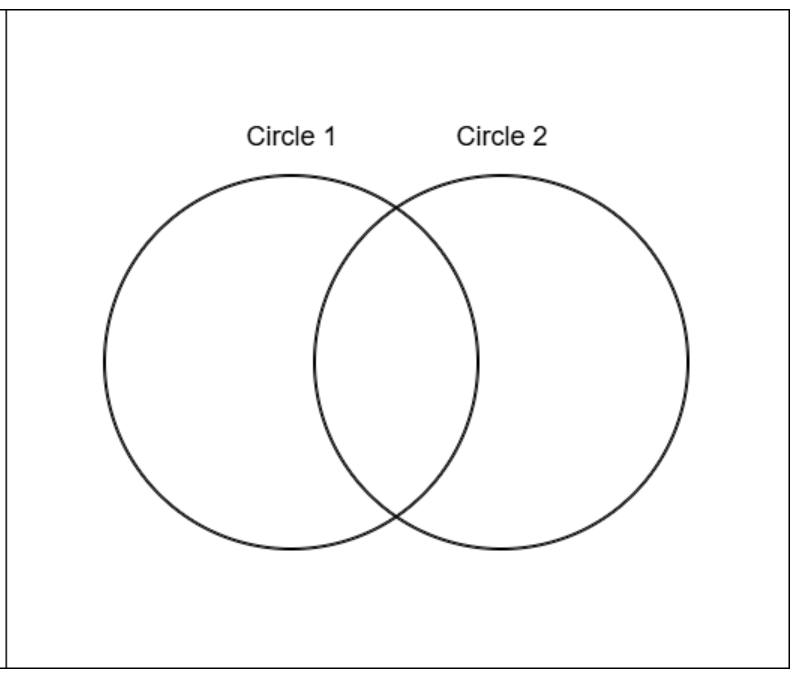
In a class of 50 students, 18 take Chorus, 26 take Band, and 2 take both Chorus and Band.
Circle 1 represents students who take Chorus and Circle 2 represents students who take Band.
Drag the numbers below into the correct locations to illustrate this data.
You will not use all of the numbers.
A guidance counselor is scheduling students for next year.
Out of the 125 rising tenth graders on their caseload, 47 of them are requesting Chemistry 64 of them are requesting Biology. 7 students are requesting both classes for next year.
Circle 1 represents students who will take Chemistry and Circle 2 represents students who will take Biology
.
Drag the numbers below into the correct locations to illustrate this data.
You will not use all of the numbers.
There are 18 people on the varsity cheerleading squad.
Below is a list of the pets they own.
· 11 have dogs
· 7 have cats
· 4 have both a cat and a dog
Select the Venn diagram that represents the varsity cheerleading squad’s pets
Which of the following Venn diagram demonstrates the statements below?
Some puppies are males.
Some old dogs are males.
No puppies are old dogs.
Create a 3 circle Venn Diagram to illustrate this problem. Use it to answer the questions below.
A local pizzeria gave each of its customers an online survey asking them what pizza toppings they liked the most.
Out of the 400 people that responded, 310 stated that they liked Pepperoni, 164 responded that they liked Sausage, while 176 said that they preferred Veggies.
82 people liked all three toppings, 64 liked just Pepperoni and Sausage, 77 liked just Pepperoni and Veggies, while no one responded that they liked both Sausage and Veggies. The rest of the people responded that they did not like any toppings on their pizza.
How many people prefer just Sausage on their pizza?
How many people like Pepperoni and Sausage on their pizza?
How many people do not like any toppings on their pizza?
How many people like Pepperoni but not Sausage on their pizza?
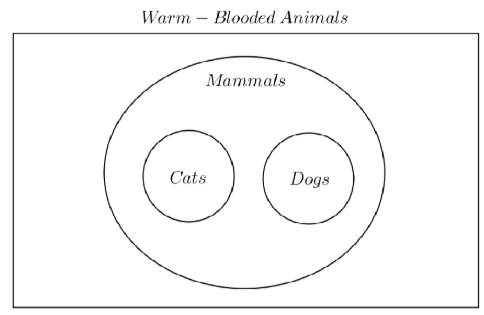
All Dogs and Cats are Mammals.
No Dog is a Warm-Blooded Animal.
All Mammals are Warm-Blooded Animals.