Homework: Biological Levels in Biology
star
star
star
star
star
Posljednje ažuriranje over 1 year ago
9
1
1
10
1
Organize the following levels of life
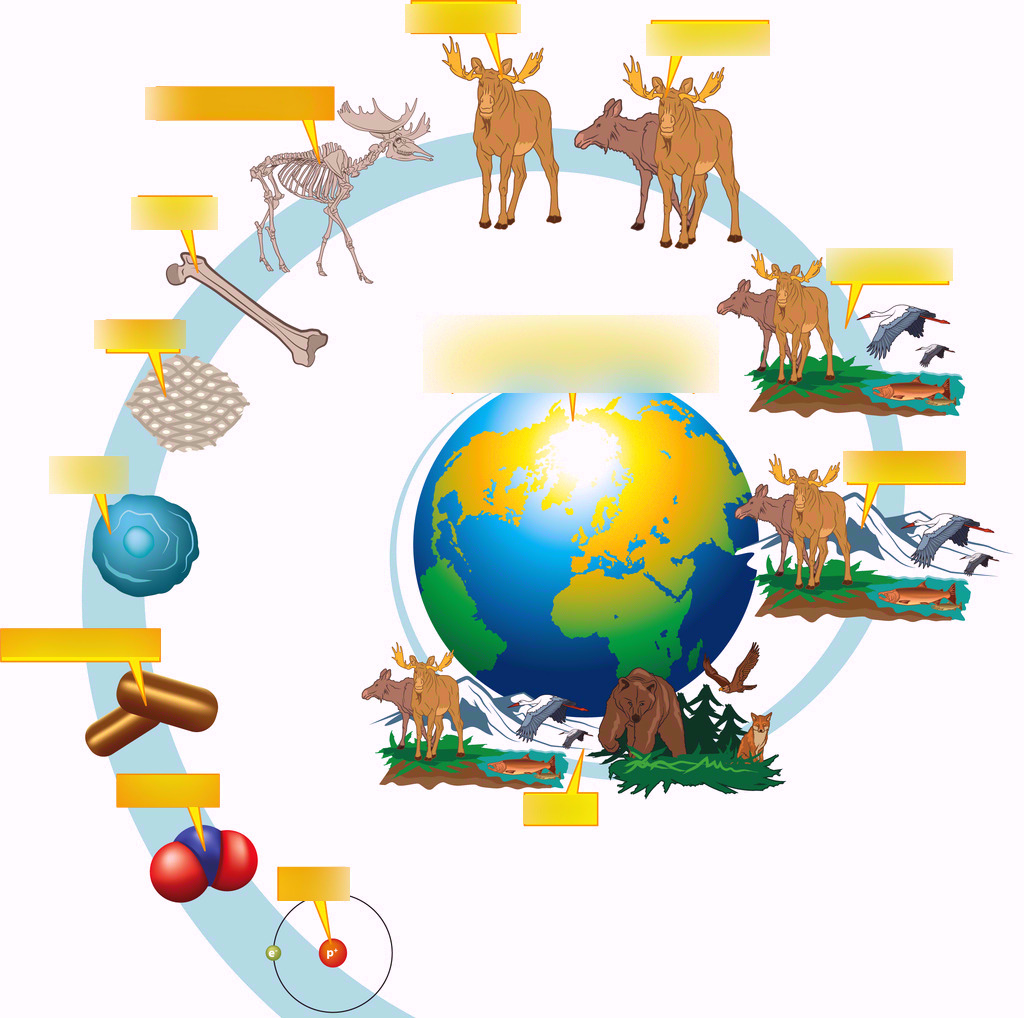
Drag and drop the correct blanks to the diagram
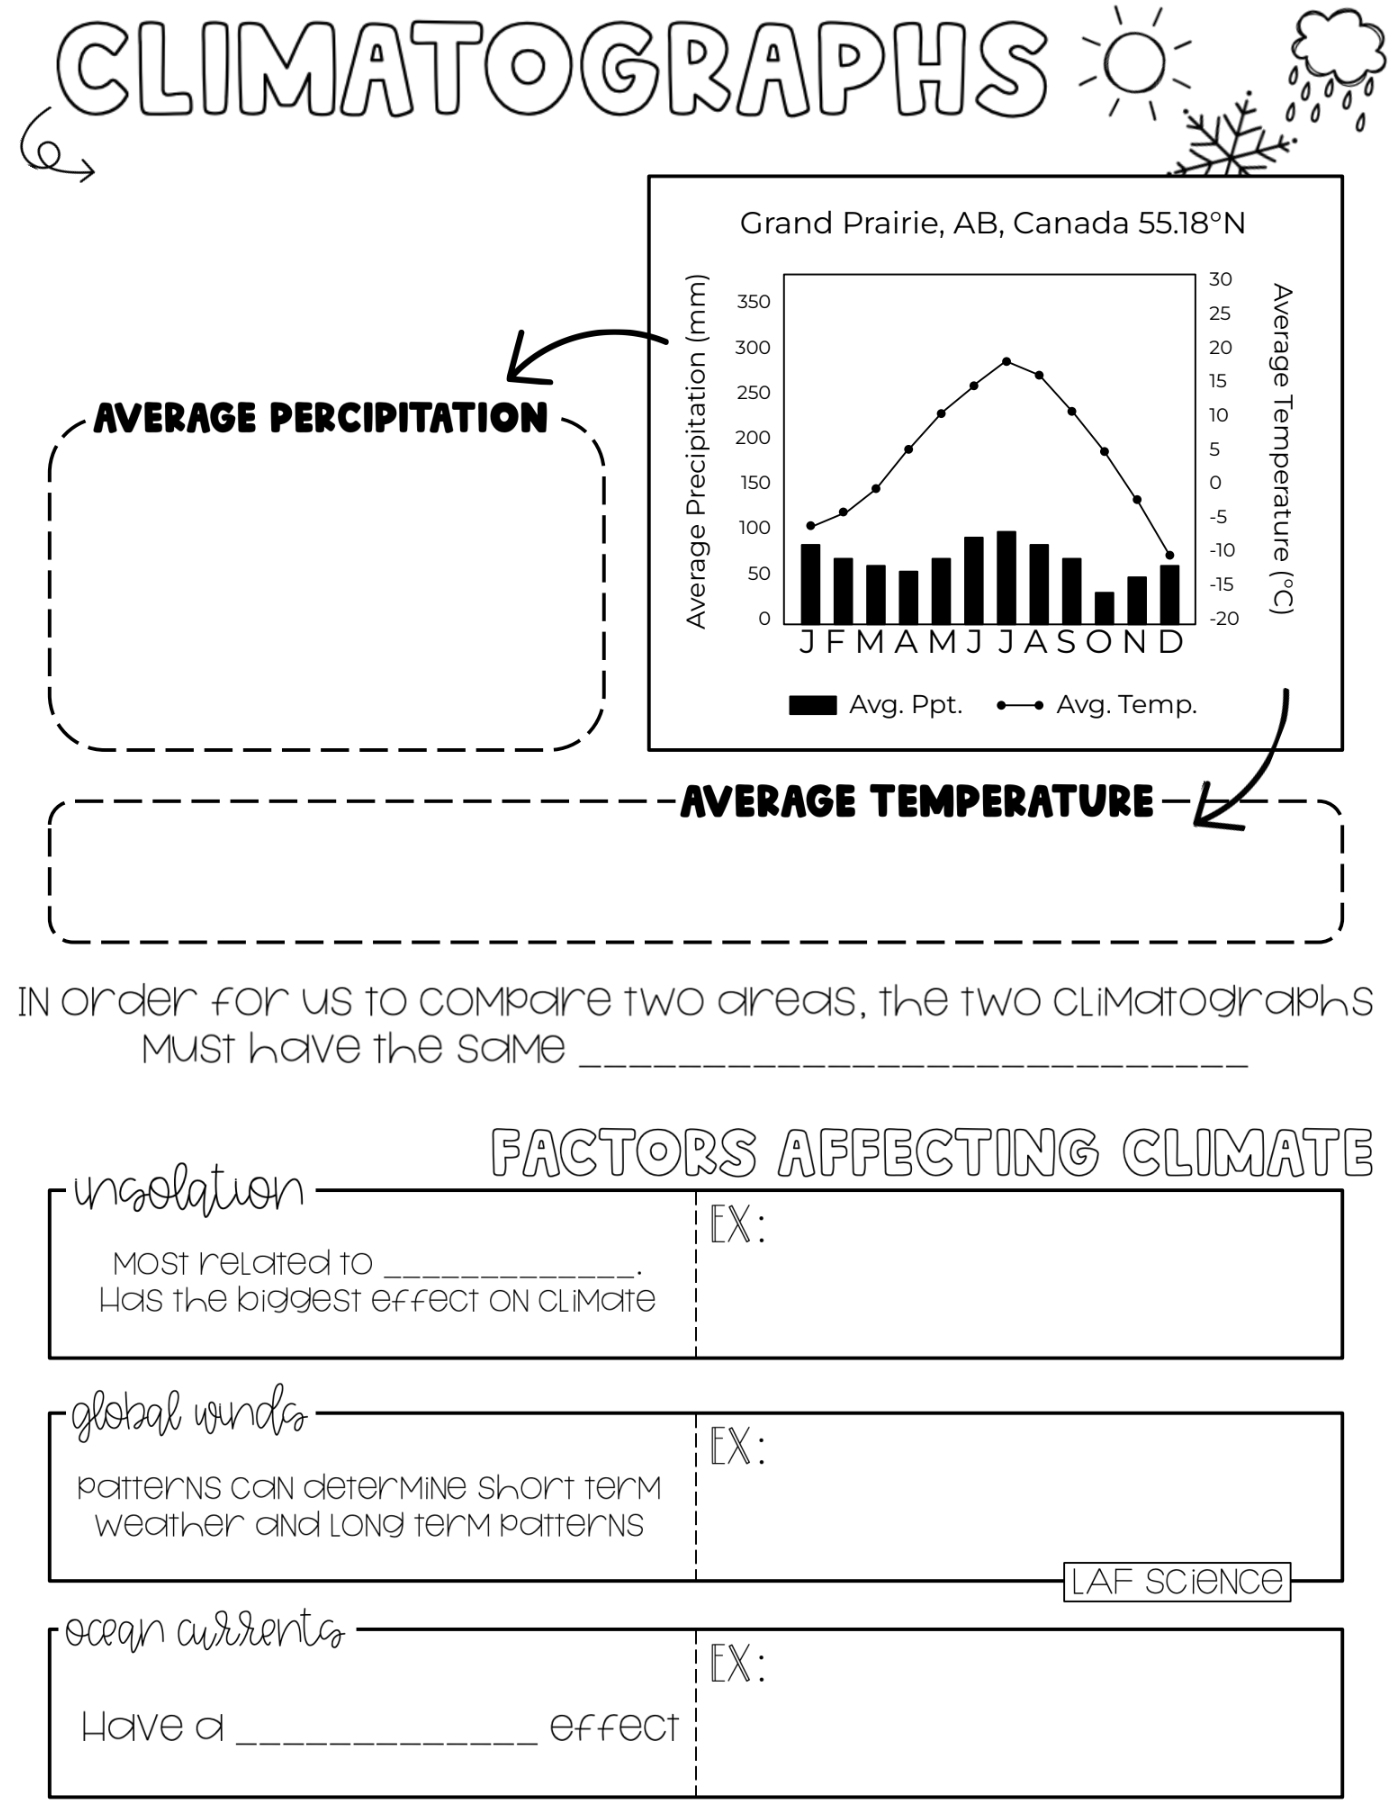
Chicago is called “The Windy City”
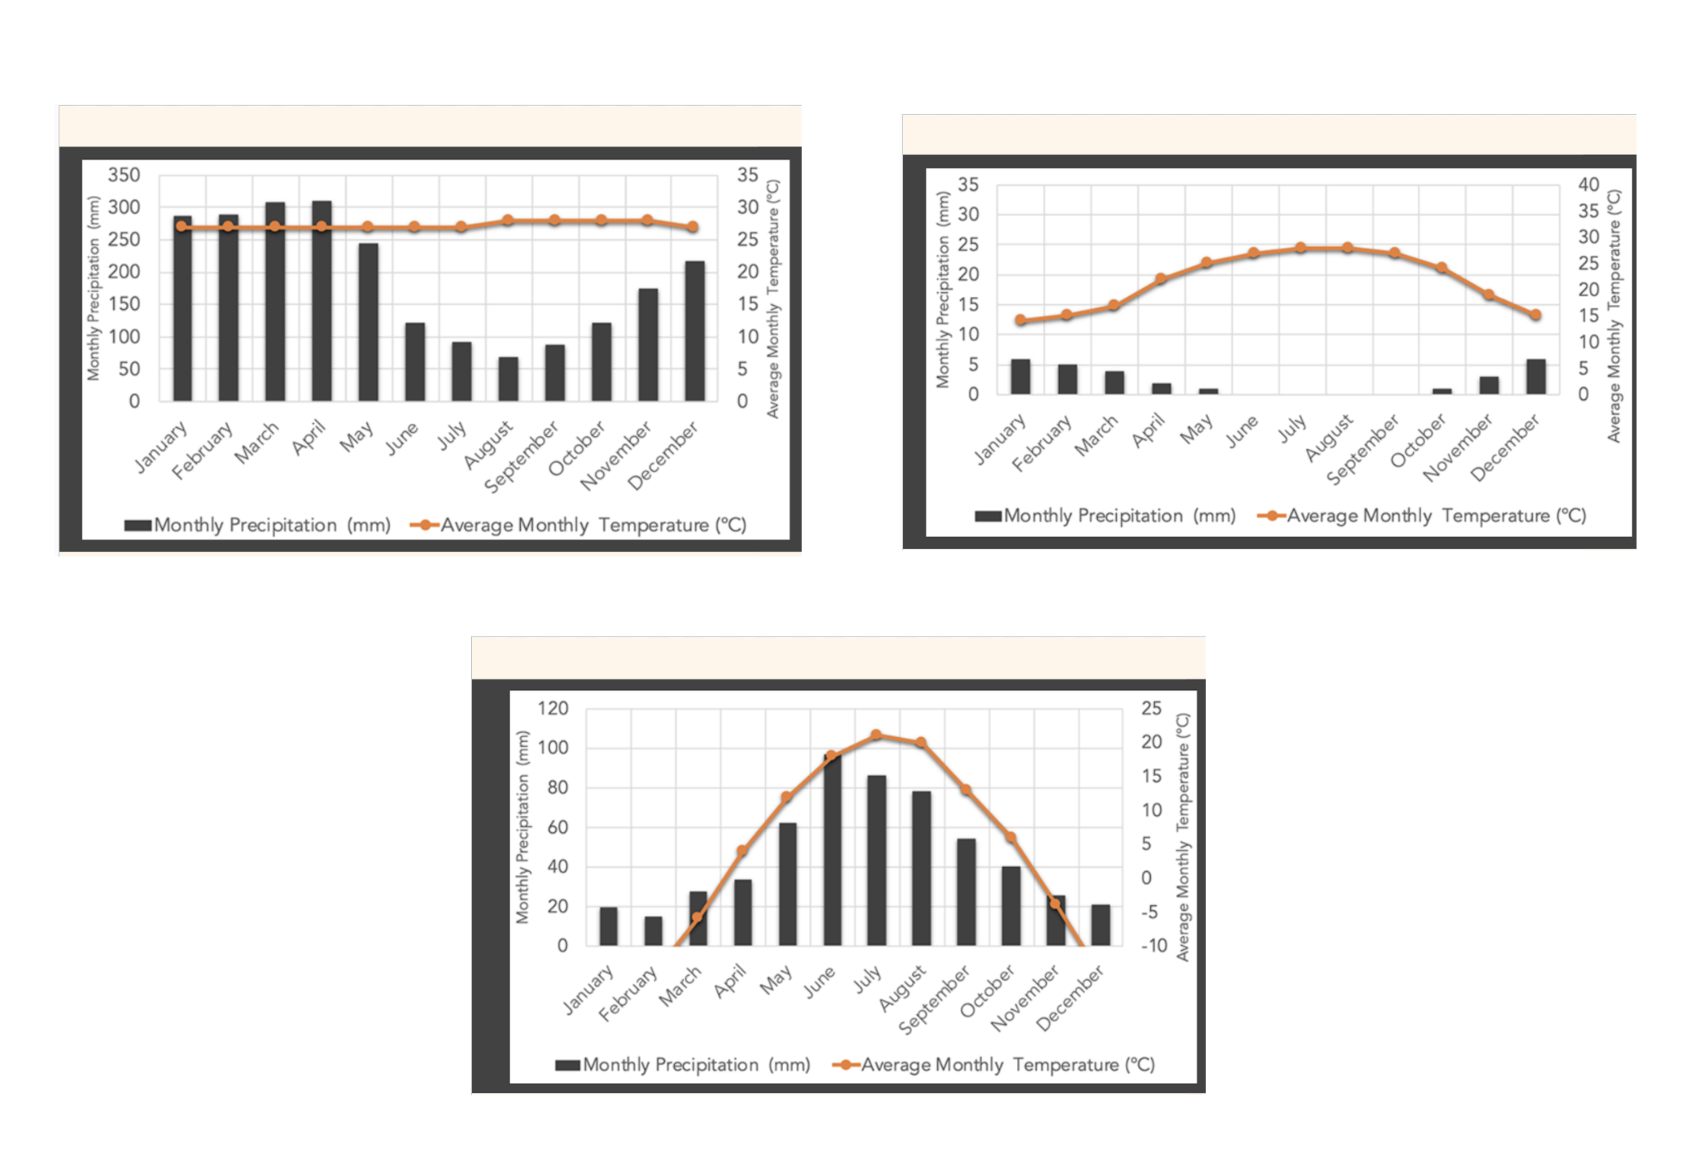
scale on the vertical axes
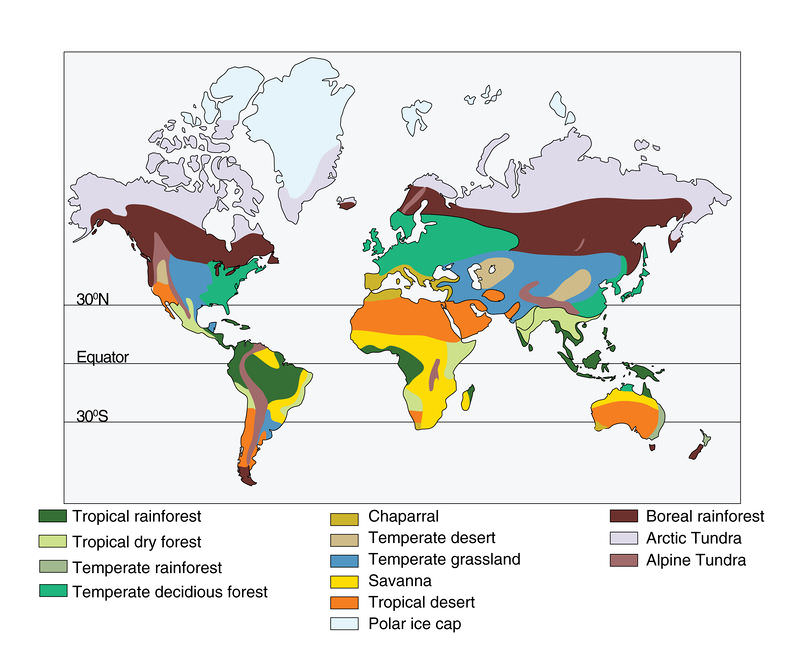
latitude
Always plotted as a BAR GRAPH (imagine raindrops collecting in a bucket)
Areas near the equator get lots of direct sunlight, so they have hotter climates
moderating
Vancouver has a warmer climate than Edmonton despite being at similar latitudes
Always plotted as a LINE GRAPH
A graph that shows us the average temperature AND precipitation of a location over one year
Use the following information to make a climatograph. Don’t forget a title, axis
(with units), and a legend.


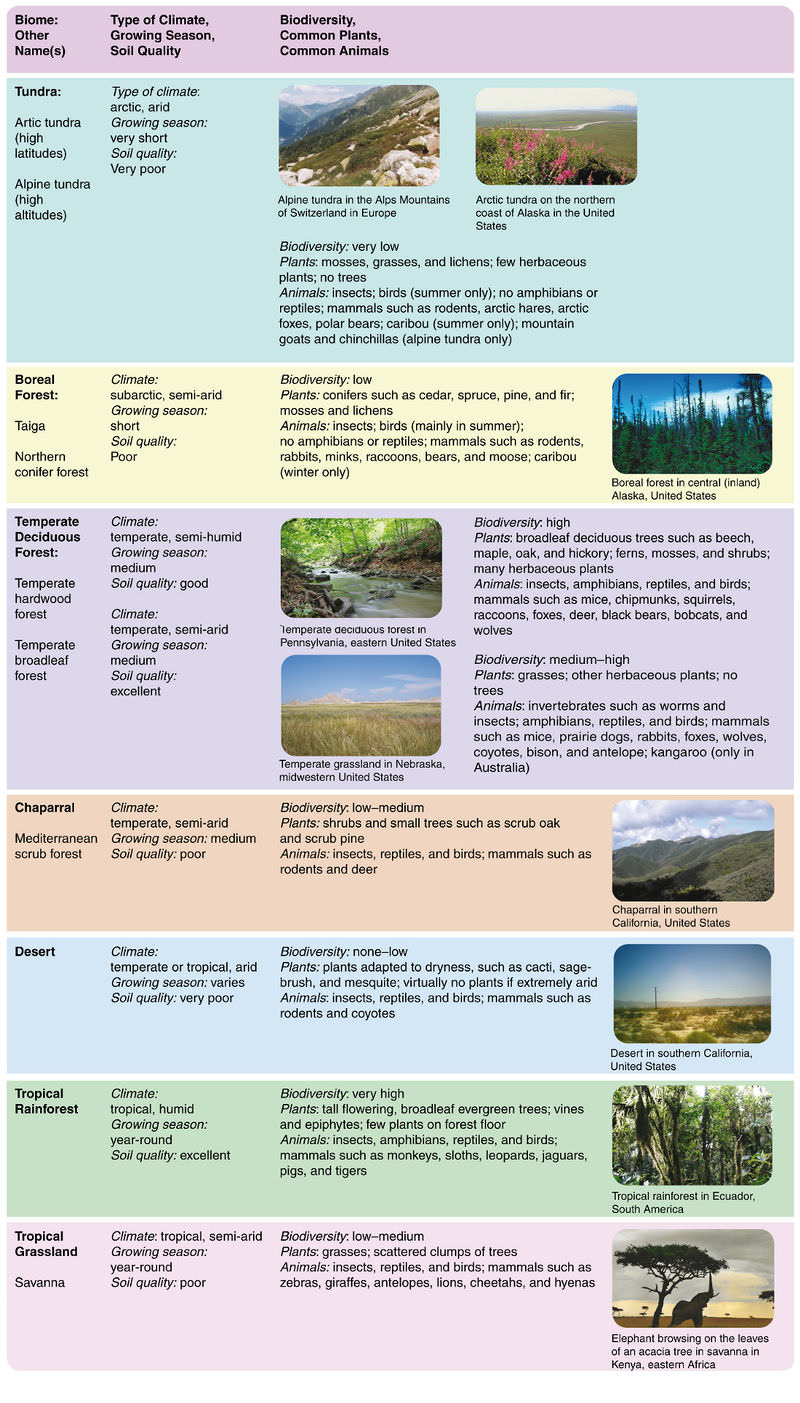
Using the graphs that you constructed in the previous question. Name the following biomes. Here is a chart to help as well.