Twenty students were asked how many hours they worked per day. Their responses, in hours, are as follows: 5; 6; 3; 3; 2; 4; 7; 5; 2; 3; 5; 6; 5; 4; 4; 3; 5; 2; 5; 3.
Nominal scale level- Is qualitative (categorical). This would be categories, names, labels and favorite foods. There is no order and makes no sense to put
Ordinal scale level- Is similar to nominal scale, but can be ordered based on a scale. Question like "excellent, good, satisfactory, and unsatisfactory", top 5 parks, or rankings in a race would be an Ordinal scale.
Interval scale level- Interval Scale is order matters and there is a difference between the data. Temperature is the most common example. The difference between weather means something, but 0 is not the absolute lowest it can be.
Ratio scale level- Ratio is like interval where 0 is the lowest point available. In this case the difference matters and so does multiplying. Test scores would be and example of this
Instructions: Match each Scenario (A–H) to the correct Level of Measurement (1–4). Some levels may be used more than once.
A. Types of coffee: espresso, latte, cappuccino, macchiato B. Rankings in a dance competition: 1st, 2nd, 3rd C. Dates on a calendar (e.g., April 10, June 5, December 25) D. Number of hours studied for an exam E. Eye colors: blue, brown, green F. Customer satisfaction ratings: very unsatisfied, unsatisfied, neutral, satisfied, very satisfied G. Distance run (in miles) during a workout H. Years in which Olympic Games were held (e.g., 2000, 2004, 2008)
Twenty students were asked how many hours they worked per day. Their responses, in hours, are as follows: 5; 6; 3; 3; 2; 4; 7; 5; 2; 3; 5; 6; 5; 4; 4; 3; 5; 2; 5; 3.
Rounding may cause the final result not to equal to 1, but they should still be close to 1
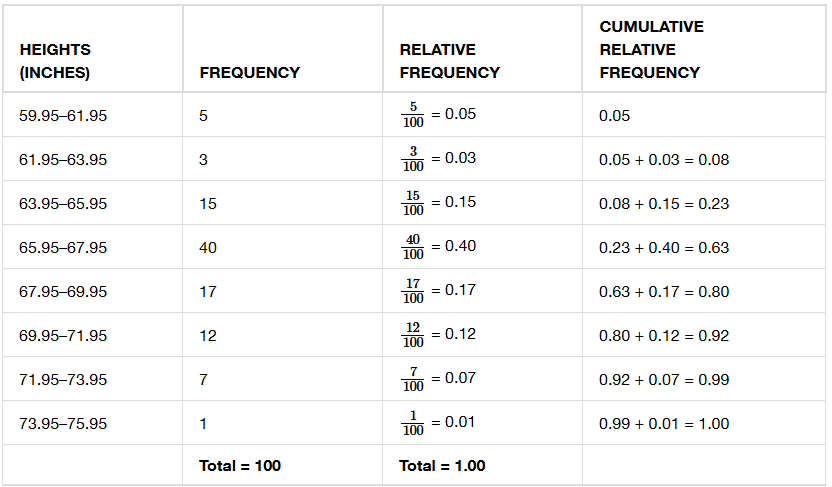
What percentage of heights are less than 65.95 inches?
What percentage of heights fall between 61.95 and 65.95?
The percentage of heights that are from 67.95 to 71.95 inches is:
The percentage of heights that are from 67.95 to 73.95 inches is:
The percentage of heights that are more than 65.95 inches is:
The number of players in the sample who are between 61.95 and 71.95 inches tall is:
What kind of data are the heights?
Describe how you could gather this data (the heights) so that the data are characteristic of all semiprofessional soccer players.
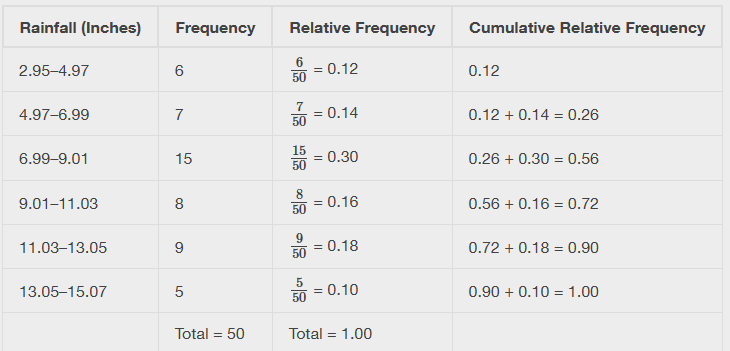
What percentage of rainfall is less than 9.01 inches
Find the percentage of rainfall that falls between 6.99 and 13.05 inches
Find the percentage of rainfall that falls between 2.95 and 9.01 inches
What fraction of the towns surveyed get between 11.03 and 13.05
Is the table correct? If it is not correct, what is wrong?
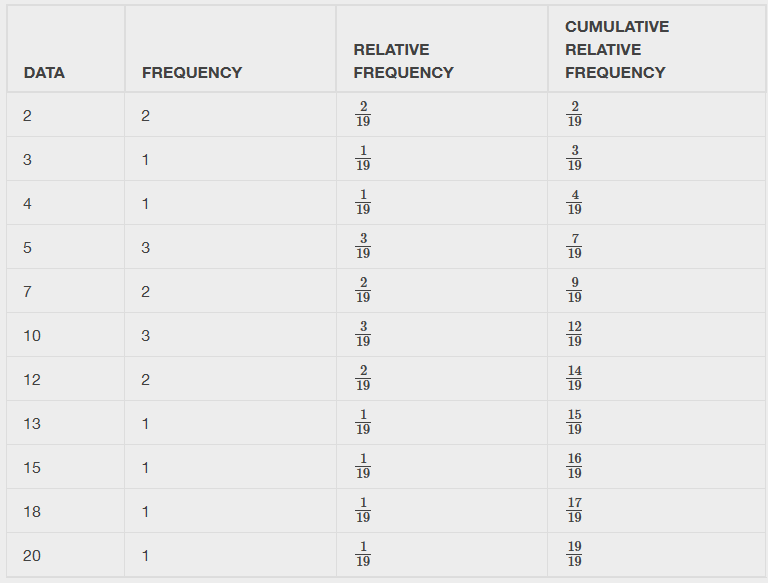
Three percent of the people surveyed commute three miles or less.
What fraction of the people surveyed commute five or seven miles?
What fraction of the people surveyed commute 12 miles or more?
Less than 12 miles?
Between five and 13 miles?
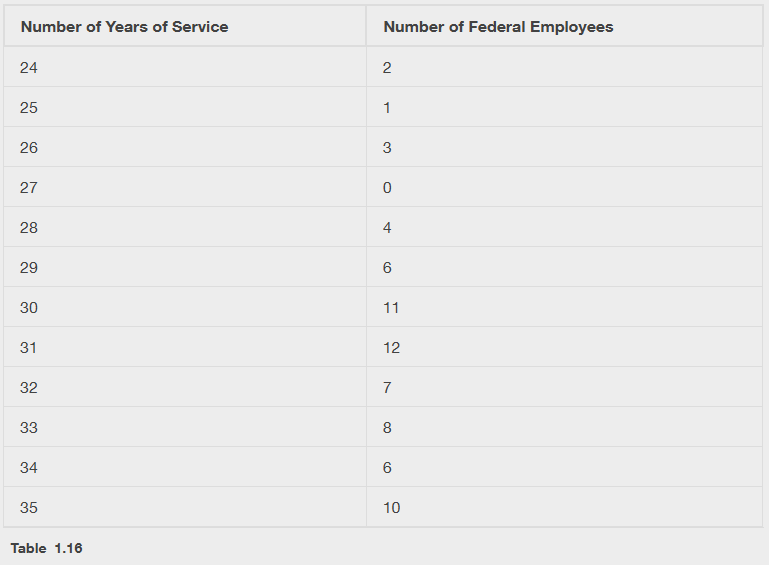
What is the cumulative frequency for years of service between 30 and 35 (inclusive)?
What is the relative frequency for 30 years of service?
What is the relative frequency for 30 years of service or less?
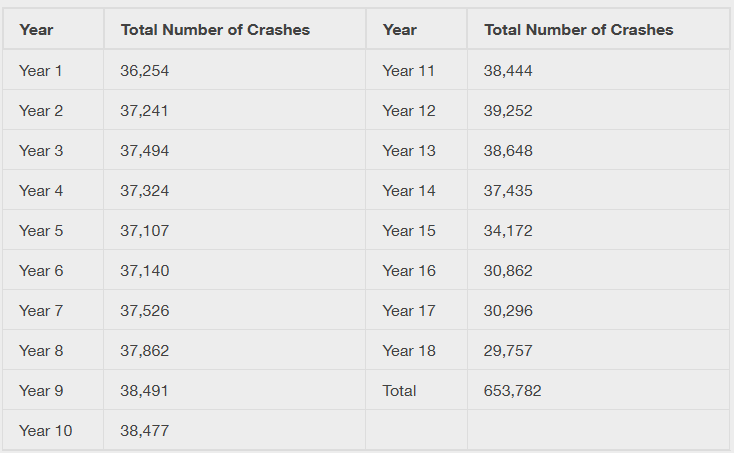
What is the frequency of deaths measured from Year 7 through Year 11?
What percentage of deaths occurred after Year 13?
What is the relative frequency of deaths that occurred in Year 7 or before?
What is the percentage of deaths that occurred in Year 18?
What is the cumulative relative frequency for Year 13?


