Do First: Climatographs of Biomes
star
star
star
star
star
Posljednje ažuriranje over 1 year ago
2 questions
1
1
![]()
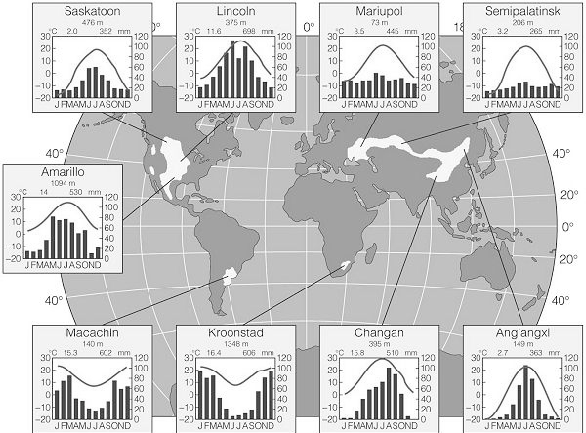
A climate graph is a graph in which temperature and precipitation are both represented on the same graph. In these examples below the temperature is on the right in Celsius and the precipitation is represented by a bar graph on the left in millimeters. Take a look at a couple of the major biomes and see what their climber graphs look like.

First is a desert this desert is pretty easy to recognize. The temperatures are either warm or hot and they don't fluctuate a lot during the year but mainly take a look at the rainfall. There is very little or no
![]()
Next is a grassland of North America. There's little rain in the winter and then a fair amount in the

This next graph is a savanna and you can notice that the temperatures are

The rainforest is very easy to figure out because notice that there is very little

The deciduous forest is next. It has a temperature graph that you can see in which the winters aren't frigid and bitter and the summers aren't super hot. Rain will fall
![]()
Compare this to a taiga and it's very similar to the deciduous forests but the winters are
![]()
Finally the tundra is where we find the coldest temperatures. It only warms up in the summer to
Match the biomes to their proper climatograph


Desert
Grassland
Savanna
Rain Forest
Deciduous Forest
Tundra
Taiga