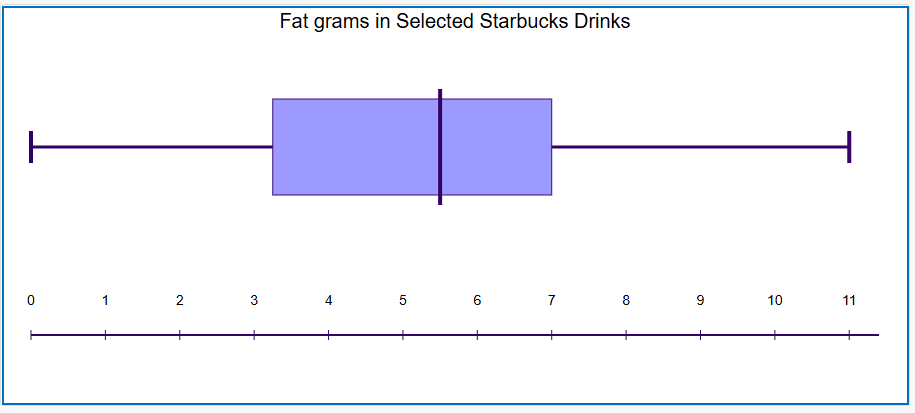
Essential Question: How can we analyze and interpret data to make informed decisions?
Learning Target: Students will be able to summarize and interpret data using measures of central tendency (mean, median, mode, range, and quartiles) and create visual representations (such as graphs and charts) to effectively communicate their findings.
Show your work for full credit.
This a box and whisker plot, select the minimum value and the maximum value.
This a box and whisker plot, select the lower quartile and the upper quartile.
Match the measures of center to the corresponding part of the diagram.
Based on the diagram, match the measures of center to the corresponding part of the diagram.
Use your data from question 1 to complete the box and whisker plot.
Use your data from question 3 to complete the box and whisker plot.
Use your data from question 4 to complete the box and whisker plot.
Use this data set to construct a stem and leaf plot by dragging the numbers into their correct position:
98, 60, 80, 91, 52, 72, 72, 66, 92, 75, 84, 82, 66