M6|L13: Exit ticket
star
star
star
star
star
Posljednje ažuriranje 12 months ago
3 questions
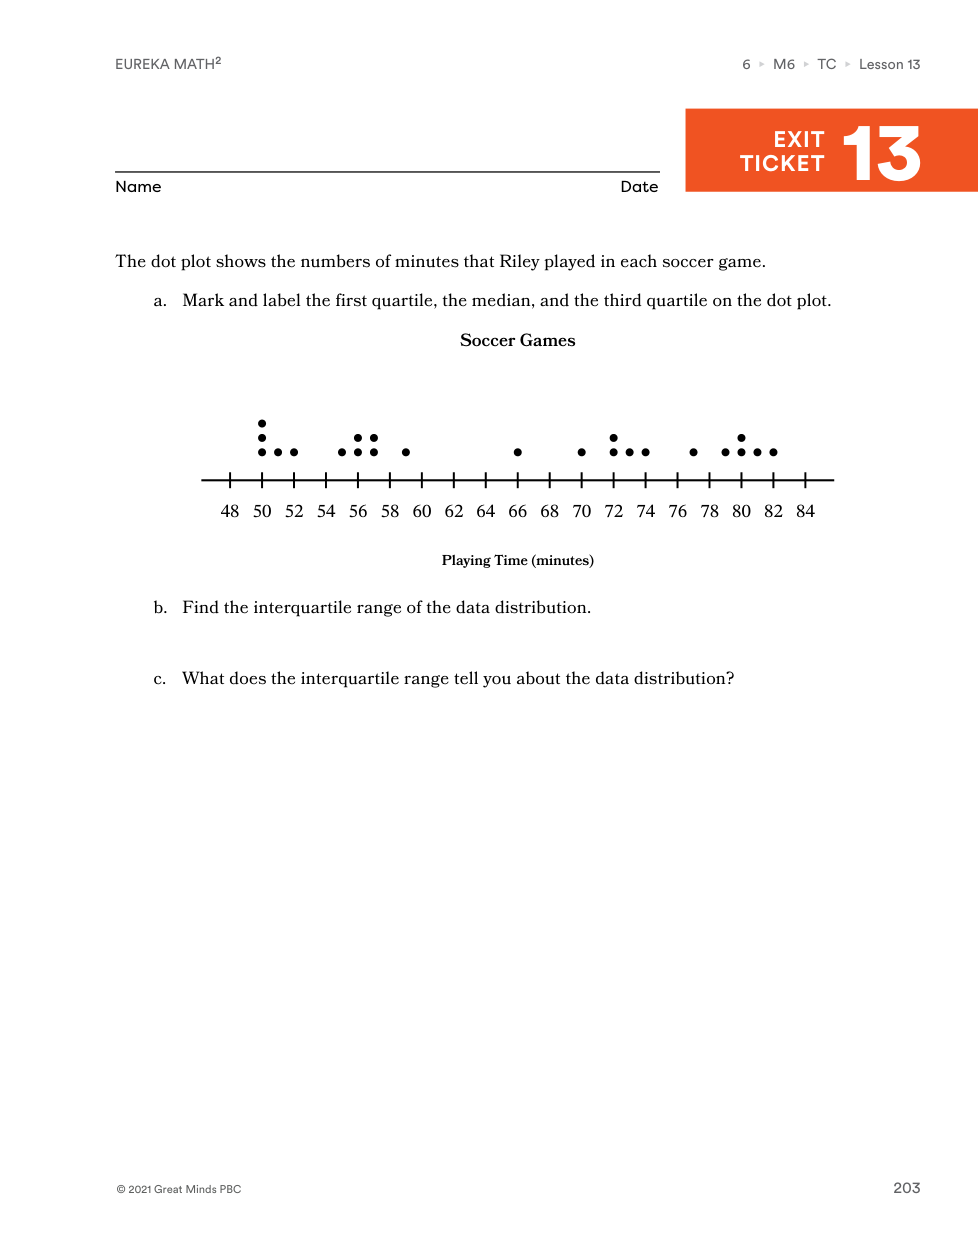
Mark and label the first quartile, the median, and the third quartile on the dot plot.
Find the interquartile range of the data distribution.
What does the interquartile range tell you about the data distribution?