Click on the graph background to add a point. Click on a point to make it dotted. Click it again to delete it. Add two points to create a line segment.
1 point
1
Question 3
3.
Write your solution like:
1 point
1
Question 4
4.
Which BEST explains your graph.
Click the graph tab.
Click on the graph background to add a point. Click on a point to make it dotted. Click it again to delete it. Add two points to create a line segment.
1 point
1
Question 5
5.
Write your solution like:
1 point
1
Question 6
6.
Which BEST explains your graph.
Click the graph tab.
Click on the graph background to add a point. Click on a point to make it dotted. Click it again to delete it. Add two points to create a line segment.
1 point
1
Question 7
7.
Write your solution like:
1 point
1
Question 8
8.
Which BEST explains your graph.
Click the graph tab.
Click on the graph background to add a point. Click on a point to make it dotted. Click it again to delete it. Add two points to create a line segment.
1 point
1
Question 9
9.
Write your solution like:
1 point
1
Question 10
10.
Which BEST explains your graph.
Click the graph tab.
Click on the graph background to add a point. Click on a point to make it dotted. Click it again to delete it. Add two points to create a line segment.
1 point
1
Question 11
11.
Write your solution like:
1 point
1
Question 12
12.
Which BEST explains your graph.
Click the graph tab.
Click on the graph background to add a point. Click on a point to make it dotted. Click it again to delete it. Add two points to create a line segment.
1 point
1
Question 13
13.
Write your solution like:
1 point
1
Question 14
14.
Which BEST explains your graph.
Click the graph tab.
Click on the graph background to add a point. Click on a point to make it dotted. Click it again to delete it. Add two points to create a line segment.
1 point
1
Question 15
15.
Write your solution like:
1 point
1
Question 16
16.
Which BEST explains your graph.
Click the graph tab.
Click on the graph background to add a point. Click on a point to make it dotted. Click it again to delete it. Add two points to create a line segment.
1 point
1
Question 17
17.
Write your solution like:
1 point
1
Question 18
18.
Which BEST explains your graph.
Click the graph tab.
Click on the graph background to add a point. Click on a point to make it dotted. Click it again to delete it. Add two points to create a line segment.
1 point
1
Question 19
19.
Write your solution like:
1 point
1
Question 20
20.
Which BEST explains your graph.
Click the graph tab.
Click on the graph background to add a point. Click on a point to make it dotted. Click it again to delete it. Add two points to create a line segment.
1 point
1
Question 21
21.
Write your solution like:
1 point
1
Question 22
22.
Which BEST explains your graph.
Click the graph tab.
Click on the graph background to add a point. Click on a point to make it dotted. Click it again to delete it. Add two points to create a line segment.
1 point
1
Question 23
23.
Write your solution like:
1 point
1
Question 24
24.
Which BEST explains your graph.
Click the graph tab.
Click on the graph background to add a point. Click on a point to make it dotted. Click it again to delete it. Add two points to create a line segment.
1 point
1
Question 25
25.
Write your solution like:
1 point
1
Question 26
26.
Which BEST explains your graph.
Click the graph tab.
Click on the graph background to add a point. Click on a point to make it dotted. Click it again to delete it. Add two points to create a line segment.
1 point
1
Question 27
27.
Write your solution like:
1 point
1
Question 28
28.
Which BEST explains your graph.
Click the graph tab.
Click on the graph background to add a point. Click on a point to make it dotted. Click it again to delete it. Add two points to create a line segment.
1 point
1
Question 29
29.
Write your solution like:
1 point
1
Question 30
30.
Which BEST explains your graph.
Click the graph tab.
Click on the graph background to add a point. Click on a point to make it dotted. Click it again to delete it. Add two points to create a line segment.
1 point
1
Question 31
31.
Write your solution like:
1 point
1
Question 32
32.
Which BEST explains your graph.
Click the graph tab.
Click on the graph background to add a point. Click on a point to make it dotted. Click it again to delete it. Add two points to create a line segment.
0 points
0
Question 33
33.
I will know I am successful when:
*I can
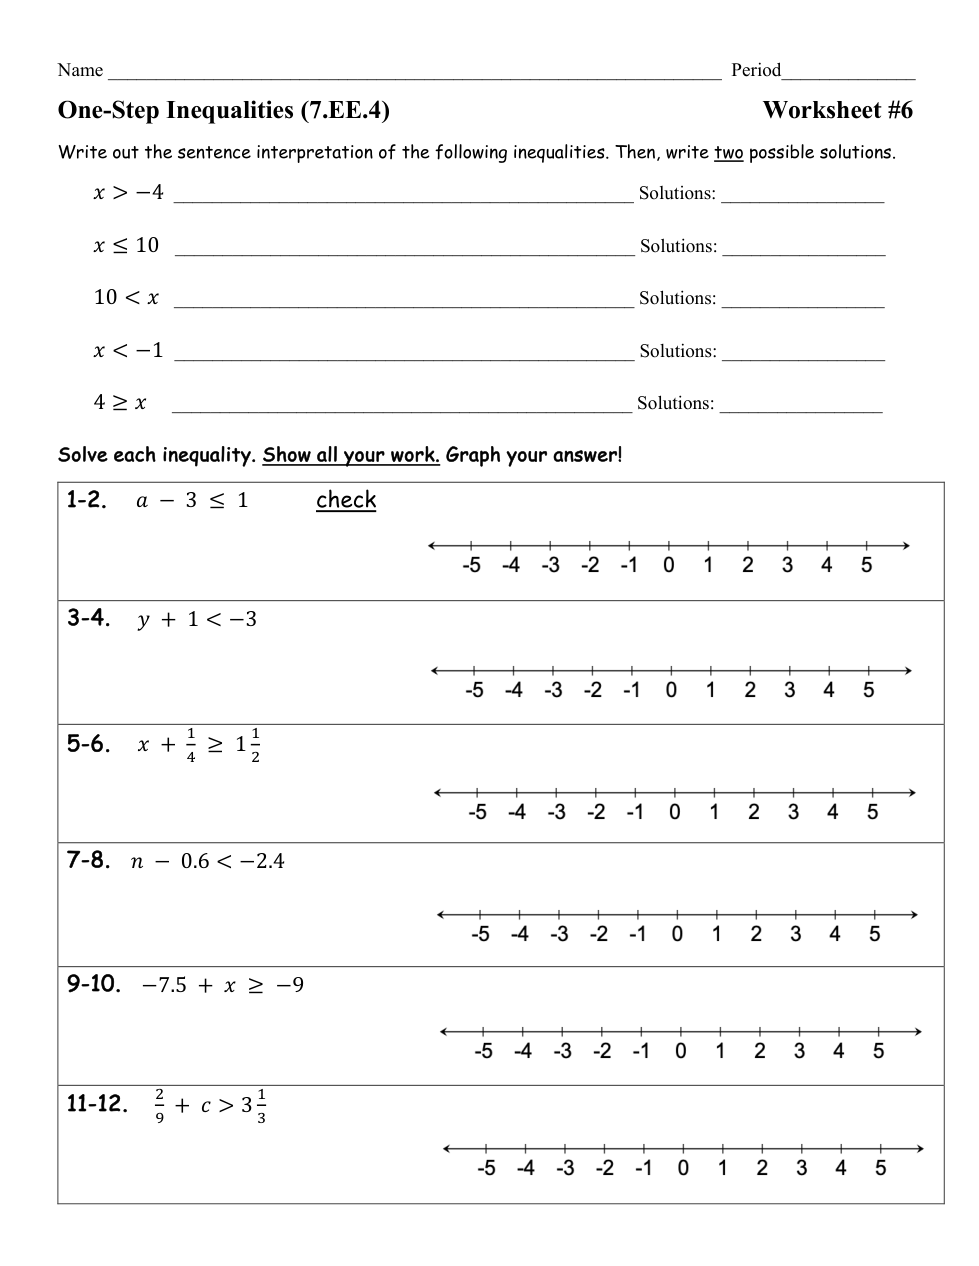
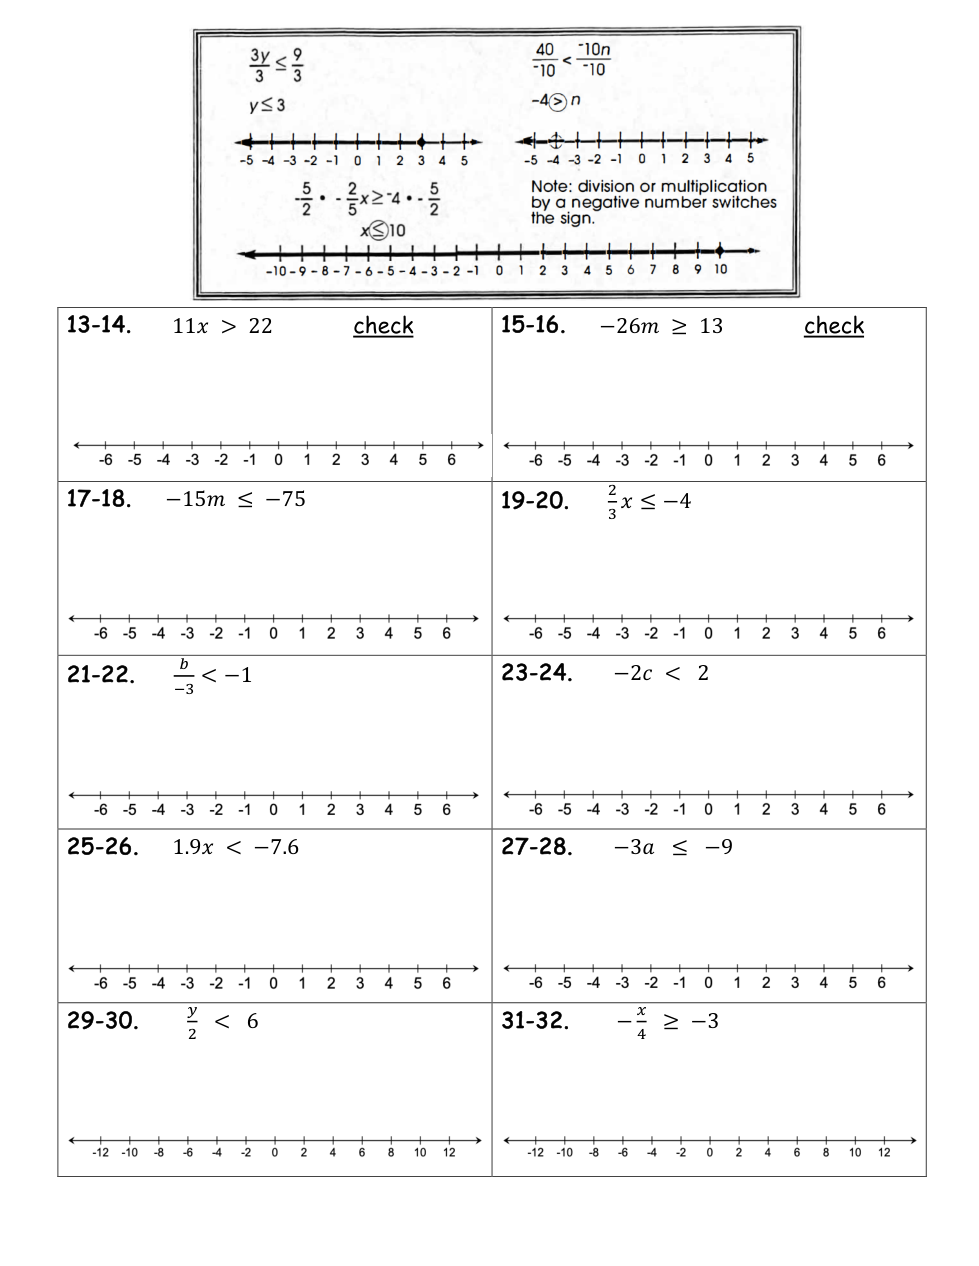
1 - solve a one-step inequality.
2 - explain how a negative coefficient affects the solution to an inequality.