Ɛhia
2
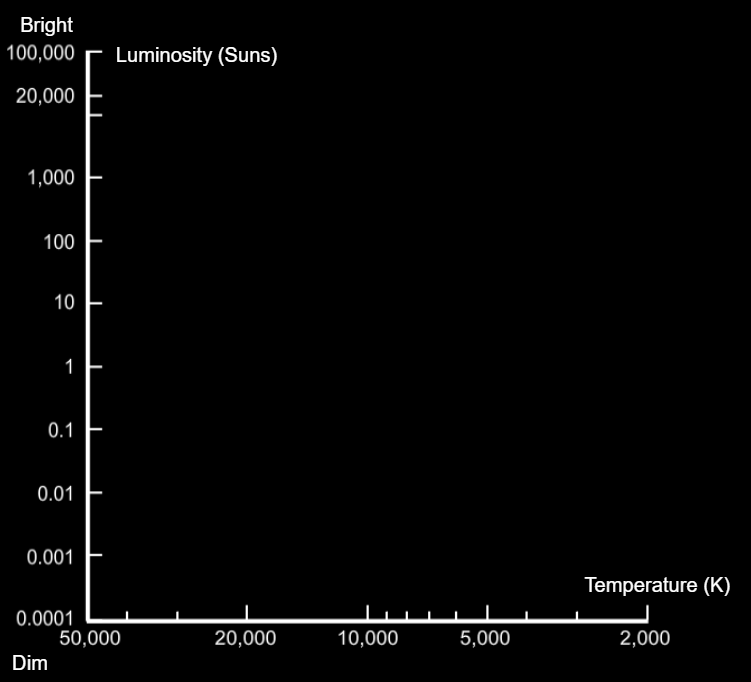
The vertical axis of the H-R diagram shows , increasing from at the bottom to high at the .
Ɛhia
2
The horizontal axis represents , but it runs in an unusual way—from on the left to on the right
The vertical axis of the H-R diagram shows , increasing from at the bottom to high at the .
The horizontal axis represents , but it runs in an unusual way—from on the left to on the right
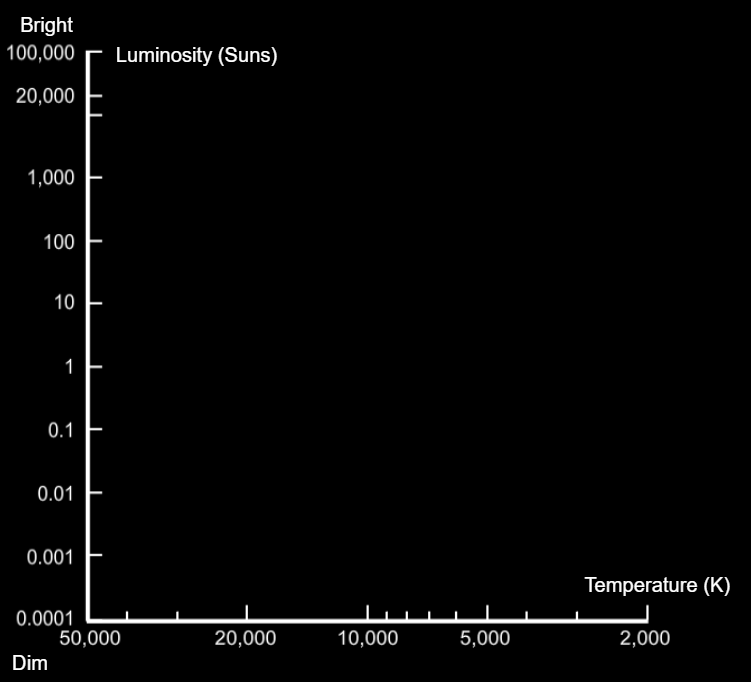
Where would you expect to find the following on the H-R diagram?
Hot, bright stars
Hot, dim stars
Cool, bright stars
Cool, dim stars
Drag the labels to the appropriate area.
hot, bright stars
cool, bright stars
hot, dim stars
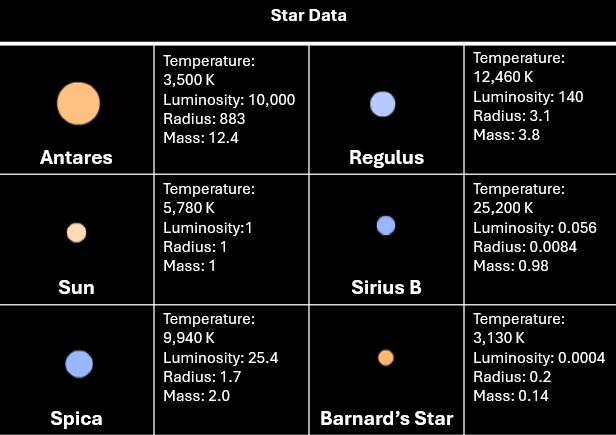
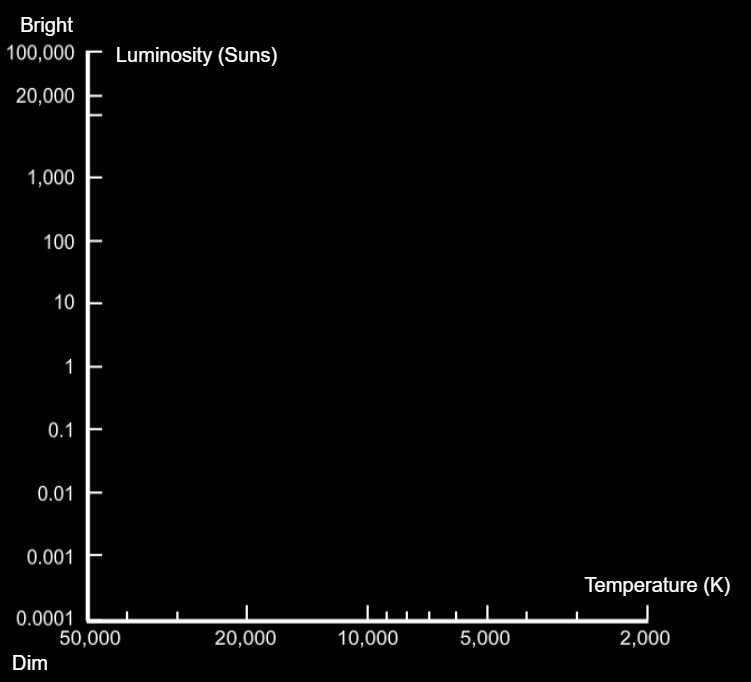
Use the star data and place each star's name where it should be found on the H-R Diagram.
Barnard's Star
Aldebaran
Sun
Sirius B
This H-R diagram has more stars added to it. Do you notice any patterns? Use the drawing tools to show how the stars could be grouped together.
This is a thinking question--no right or wrong answers!
Astronomers have grouped stars in these areas.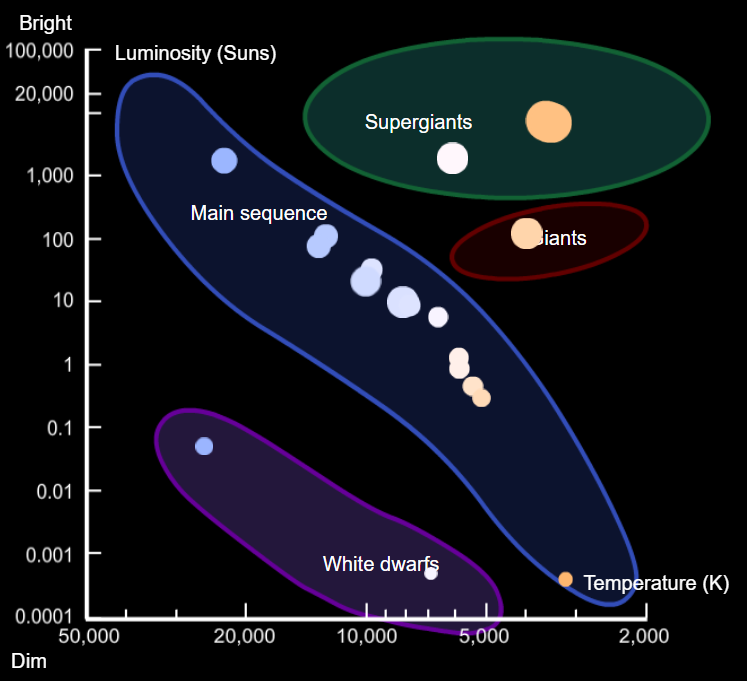 Match the group's name to the appropriate description.
| Draggable item | arrow_right_alt | Corresponding Item |
|---|---|---|
Main sequence | arrow_right_alt | Small, dim, hot stars |
White dwarfs | arrow_right_alt | Large, bright, cool stars |
Giants & Supergiants | arrow_right_alt | Where the majority of stars are found |
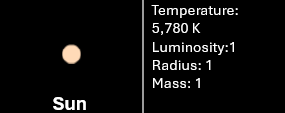
Consider the Sun's place on the HR Diagram. How does it compare to other stars?
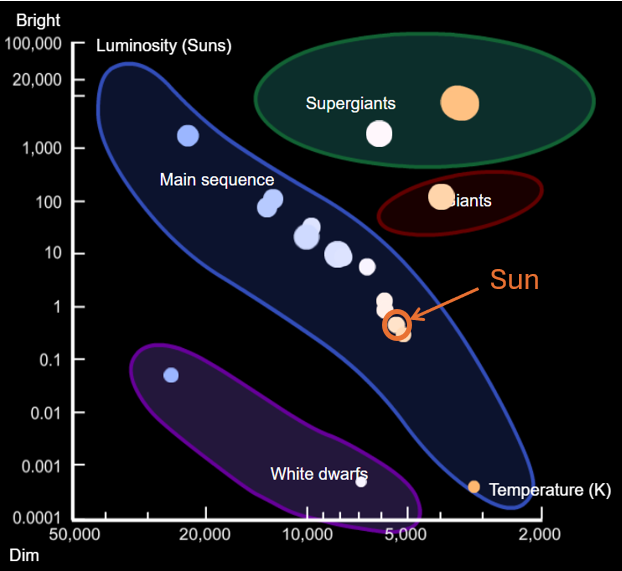
Compared to other stars, the Sun's luminosity is
Compared to other stars, the Sun's temperature is
Consider the following main sequence stars. Rank them by temperature highest to lowest.
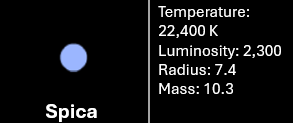
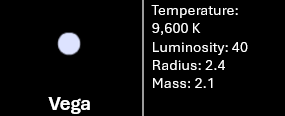
Consider the following main sequence stars. Rank them by luminosity highest to lowest.
Consider the following main sequence stars. Rank them by radius highest to lowest.
Consider the following main sequence stars. Rank them by mass highest to lowest.
The same stars from the previous questions are labeled on the HR diagram. What conclusion can you make about main sequence stars' temperature, mass, size, and luminosity?
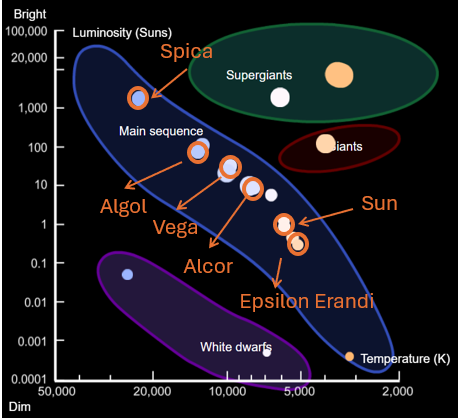
Main sequence stars are arranged on the Hertzsprung-Russell diagram so that as you move from left to right, their temperature, mass, size, and luminosity .